 .
. 
|
Go to .. | PAGE 1 | PAGE 2 | PAGE 3 | PAGE 4 | P. 5 | PAGE 6 | PAGE 7 | PAGE 8 | PAGE 9 | PAGE 10 | PAGE 11 |
Contour and Population World Maps


Contour map of the world. Elevation indicated by the color scale


FLOODED WORLD shows, in light blue, the areas that would be below sea level, if the ocean surface rose by 100 meters (light green=300m)


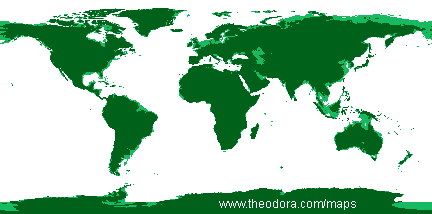
RISEN WORLD shows, in light green, the areas that would "rise" above sea level, if the ocean surface fell by 100 meters (Can you spot Atlantis?)

Click on the image above to see an animation of the progression of the techtonic plates to form the continents.

|
|


