


Population:
8,574
(July 2020 est.)
note: the Cook Islands' Ministry of Finance & Economic Management estimated the resident population to have been 11,700 in September 2016
country comparison to the world (CIA rank, may be based on non-current data):
224
[see also: Population country ranks ]
Nationality:
noun:
Cook Islander(s)
adjective:
Cook Islander
Ethnic groups:
Cook Island Maori (Polynesian) 81.3%, part Cook Island Maori 6.7%, other 11.9%
(2011 est.)
Languages:
English (official) 86.4%, Cook Islands Maori (Rarotongan) (official) 76.2%, other 8.3%
(2011 est.)
note: shares sum to more than 100% because some respondents gave more than one answer on the census
Religions:
Protestant 62.8% (Cook Islands Christian Church 49.1%, Seventh Day Adventist 7.9%, Assemblies of God 3.7%, Apostolic Church 2.1%), Roman Catholic 17%, Mormon 4.4%, other 8%, none 5.6%, no response 2.2%
(2011 est.)
Age structure:
0-14 years: 19.93%
(male 901/female 808)
[see also: Age structure - 0-14 years country ranks ]
15-24 years: 14.89%
(male 684/female 593)
[see also: Age structure - 15-24 years country ranks ]
25-54 years: 37.66%
(male 1,595/female 1,634)
[see also: Age structure - 25-54 years country ranks ]
55-64 years: 14.15%
(male 674/female 539)
[see also: Age structure - 55-64 years country ranks ]
65 years and over: 13.37%
(male 555/female 591)
(2020 est.)
[see also: Age structure - 65 years and over country ranks ]
population pyramid:
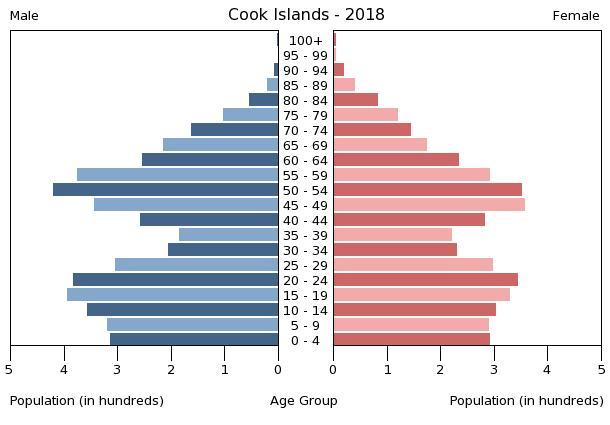
This is the population pyramid for Cook Islands. A population pyramid illustrates the age and sex structure of a country's population and may provide insights about political and social stability, as well as economic development. The population is distributed along the horizontal axis, with males shown on the left and females on the right. The male and female populations are broken down into 5-year age groups represented as horizontal bars along the vertical axis, with the youngest age groups at the bottom and the oldest at the top. The shape of the population pyramid gradually evolves over time based on fertility, mortality, and international migration trends.
For additional information, please see the entry for Population pyramid on the Definitions and Notes page under the References tab.
Median age:
total: 38.3 years
[see also: Median age - total country ranks ]
male: 37.8 years
[see also: Median age - male country ranks ]
female: 38.7 years
(2020 est.)
[see also: Median age - female country ranks ]
country comparison to the world (CIA rank, may be based on non-current data):
64
Population growth rate:
-2.59%
(2020 est.)
country comparison to the world (CIA rank, may be based on non-current data):
236
[see also: Population growth rate country ranks ]
Birth rate:
13.3 births/1,000 population
(2020 est.)
country comparison to the world (CIA rank, may be based on non-current data):
140
[see also: Birth rate country ranks ]
Death rate:
9 deaths/1,000 population
(2020 est.)
country comparison to the world (CIA rank, may be based on non-current data):
61
[see also: Death rate country ranks ]
Net migration rate:
-29.9 migrant(s)/1,000 population
(2020 est.)
country comparison to the world (CIA rank, may be based on non-current data):
227
[see also: Net migration rate country ranks ]
Population distribution:
most of the population is found on the island of Rarotonga
Urbanization:
urban population: 75.3% of total population
(2019)
[see also: Urbanization - urban population country ranks ]
rate of urbanization: 0.37% annual rate of change
(2015-20 est.)
[see also: Urbanization - rate of urbanization country ranks ]
Sex ratio:
at birth: 1.05 male(s)/female
(2020 est.)
[see also: Sex ratio - at birth country ranks ]
0-14 years: 1.12 male(s)/female
(2020 est.)
[see also: Sex ratio - 0-14 years country ranks ]
15-24 years: 1.15 male(s)/female
(2020 est.)
[see also: Sex ratio - 15-24 years country ranks ]
25-54 years: 0.98 male(s)/female
(2020 est.)
[see also: Sex ratio - 25-54 years country ranks ]
55-64 years: 1.25 male(s)/female
(2020 est.)
[see also: Sex ratio - 55-64 years country ranks ]
65 years and over: 0.94 male(s)/female
(2020 est.)
[see also: Sex ratio - 65 years and over country ranks ]
total population: 105.9 male(s)/female
(2020 est.)
[see also: Sex ratio country ranks ]
Infant mortality rate:
total: 11.9 deaths/1,000 live births
[see also: Infant mortality rate - total country ranks ]
male: 14.4 deaths/1,000 live births
[see also: Infant mortality rate - male country ranks ]
female: 9.2 deaths/1,000 live births
(2020 est.)
[see also: Infant mortality rate - female country ranks ]
country comparison to the world (CIA rank, may be based on non-current data):
108
Life expectancy at birth:
total population: 76.6 years
[see also: Life expectancy at birth - total population country ranks ]
male: 73.8 years
[see also: Life expectancy at birth - male country ranks ]
female: 79.6 years
(2020 est.)
[see also: Life expectancy at birth - female country ranks ]
country comparison to the world (CIA rank, may be based on non-current data):
93
[See also: Healthy Life Expectancy ]
[See also: Health Performance ]
Total fertility rate:
2.12 children born/woman
(2020 est.)
country comparison to the world (CIA rank, may be based on non-current data):
97
[see also: Total fertility rate country ranks ]
Drinking water source:
improved:
urban: 99.9% of population
[see also: Drinking water source - improved - urban country ranks ]
rural: 99.9% of population
[see also: Drinking water source - improved - rural country ranks ]
total: 99.9% of population
unimproved:
urban: 0.1% of population
rural: 0.1% of population
total: 0.1% of population
(2015 est.)
Current Health Expenditure:
2.7%
(2015)
[see also: Current Health Expenditure country ranks ]
Physicians density:
1.42 physicians/1,000 population
(2014)
[see also: Physicians density country ranks ]
Sanitation facility access:
improved:
urban: 97.6% of population
(2015 est.)
[see also: Sanitation facility access - improved - urban country ranks ]
rural: 97.6% of population
(2015 est.)
[see also: Sanitation facility access - improved - rural country ranks ]
total: 97.6% of population
(2015 est.)
unimproved:
urban: 2.4% of population
(2015 est.)
rural: 2.4% of population
(2015 est.)
total: 2.4% of population
(2015 est.)
HIV/AIDS - adult prevalence rate:
NA
[see also: HIV/AIDS - adult prevalence rate country ranks ]
HIV/AIDS - people living with HIV/AIDS:
NA
[see also: HIV/AIDS - people living with HIV/AIDS country ranks ]
HIV/AIDS - deaths:
NA
[see also: HIV/AIDS - deaths country ranks ]
Obesity - adult prevalence rate:
55.9%
(2016)
country comparison to the world (CIA rank, may be based on non-current data):
2
[see also: Obesity - adult prevalence rate country ranks ]
Education expenditures:
4.7% of GDP
(2016)
country comparison to the world (CIA rank, may be based on non-current data):
77
[see also: Education expenditures country ranks ]
School life expectancy (primary to tertiary education):
total: 15 years
[see also: School life expectancy (primary to tertiary education) - total country ranks ]
male: 15 years
[see also: School life expectancy (primary to tertiary education) - male country ranks ]
female: 16 years
(2015)
[see also: School life expectancy (primary to tertiary education) - female country ranks ]
NOTE: 1) The information regarding Cook Islands on this page is re-published from the 2020 World Fact Book of the United States Central Intelligence Agency and other sources. No claims are made regarding the accuracy of Cook Islands People 2020 information contained here. All suggestions for corrections of any errors about Cook Islands People 2020 should be addressed to the CIA or the source cited on each page.
2) The rank that you see is the CIA reported rank, which may have the following issues:
a) They assign increasing rank number, alphabetically for countries with the same value of the ranked item, whereas we assign them the same rank.
b) The CIA sometimes assigns counterintuitive ranks. For example, it assigns unemployment rates in increasing order, whereas we rank them in decreasing order.
- Main Index
- 2020 Index
- Country Ranks
- Definitions
- Cook Islands Index 2020
- Cook Islands Main Index
- Introduction
- Geography
- Maps
- People
- Religion
- Government
- Gov. Leaders
- Flags
- Economy
- Energy
- Communications
- Transportation
- Airport Codes
- Military
- Transnational Issues
- Photos
- Advertise Here
- Feedback

This page was last modified 27-Jan-20