


Population:
101,073
(July 2020 est.)
country comparison to the world (CIA rank, may be based on non-current data):
196
[see also: Population country ranks ]
Nationality:
noun:
Channel Islander(s)
adjective:
Channel Islander
Ethnic groups:
Jersey 46.4%, British 32.7%, Portuguese/Madeiran 8.2%, Polish 3.3%, Irish, French, and other white 7.1%, other 2.4%
(2011 est.)
Languages:
English 94.5% (official), Portuguese 4.6%, other 0.9%
(2001 est.)
Religions:
Protestant (Anglican, Baptist, Congregational New Church, Methodist, Presbyterian), Roman Catholic
Age structure:
0-14 years: 16.63%
(male 8,689/female 8,124)
[see also: Age structure - 0-14 years country ranks ]
15-24 years: 12.98%
(male 6,764/female 6,354)
[see also: Age structure - 15-24 years country ranks ]
25-54 years: 40.12%
(male 20,499/female 20,054)
[see also: Age structure - 25-54 years country ranks ]
55-64 years: 13.22%
(male 6,515/female 6,844)
[see also: Age structure - 55-64 years country ranks ]
65 years and over: 17.05%
(male 7,324/female 9,906)
(2020 est.)
[see also: Age structure - 65 years and over country ranks ]
population pyramid:
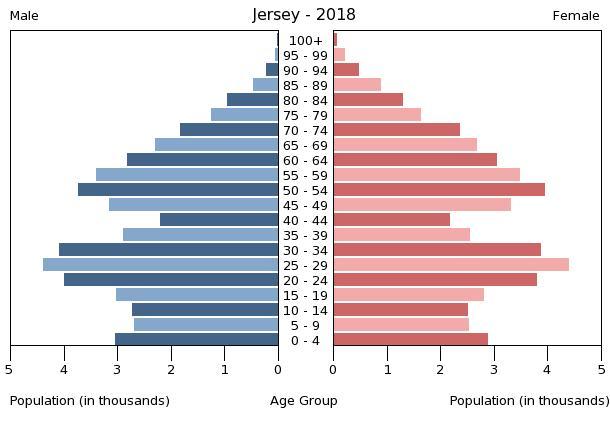
This is the population pyramid for Jersey. A population pyramid illustrates the age and sex structure of a country's population and may provide insights about political and social stability, as well as economic development. The population is distributed along the horizontal axis, with males shown on the left and females on the right. The male and female populations are broken down into 5-year age groups represented as horizontal bars along the vertical axis, with the youngest age groups at the bottom and the oldest at the top. The shape of the population pyramid gradually evolves over time based on fertility, mortality, and international migration trends.
For additional information, please see the entry for Population pyramid on the Definitions and Notes page under the References tab.
Dependency ratios:
total dependency ratio: 47.1
(2015 est.)
[see also: Dependency ratios - total dependency ratio country ranks ]
youth dependency ratio: 21.6
(2015 est.)
[see also: Dependency ratios - youth dependency ratio country ranks ]
elderly dependency ratio: 25.4
(2015 est.)
[see also: Dependency ratios - elderly dependency ratio country ranks ]
potential support ratio: 3.9
(2015 est.)
note: data represent the Guernsey and Jersey
Median age:
total: 37.5 years
[see also: Median age - total country ranks ]
male: 36 years
[see also: Median age - male country ranks ]
female: 39.5 years
(2020 est.)
[see also: Median age - female country ranks ]
country comparison to the world (CIA rank, may be based on non-current data):
70
Population growth rate:
0.72%
(2020 est.)
country comparison to the world (CIA rank, may be based on non-current data):
136
[see also: Population growth rate country ranks ]
Birth rate:
12.7 births/1,000 population
(2020 est.)
country comparison to the world (CIA rank, may be based on non-current data):
150
[see also: Birth rate country ranks ]
Death rate:
7.9 deaths/1,000 population
(2020 est.)
country comparison to the world (CIA rank, may be based on non-current data):
96
[see also: Death rate country ranks ]
Net migration rate:
2.3 migrant(s)/1,000 population
(2020 est.)
country comparison to the world (CIA rank, may be based on non-current data):
44
[see also: Net migration rate country ranks ]
Population distribution:
fairly even distribution; no notable trends
Urbanization:
urban population: 30.9% of total population
(2019)
[see also: Urbanization - urban population country ranks ]
rate of urbanization: 0.46% annual rate of change
(2015-20 est.)
note: data represent Guernsey and Jersey
Major urban areas - population:
34,000 SAINT HELIER (capital)
(2018)
Sex ratio:
at birth: 1.06 male(s)/female
(2020 est.)
[see also: Sex ratio - at birth country ranks ]
0-14 years: 1.07 male(s)/female
(2020 est.)
[see also: Sex ratio - 0-14 years country ranks ]
15-24 years: 1.06 male(s)/female
(2020 est.)
[see also: Sex ratio - 15-24 years country ranks ]
25-54 years: 1.02 male(s)/female
(2020 est.)
[see also: Sex ratio - 25-54 years country ranks ]
55-64 years: 0.95 male(s)/female
(2020 est.)
[see also: Sex ratio - 55-64 years country ranks ]
65 years and over: 0.74 male(s)/female
(2020 est.)
[see also: Sex ratio - 65 years and over country ranks ]
total population: 97.1 male(s)/female
(2020 est.)
[see also: Sex ratio country ranks ]
Infant mortality rate:
total: 3.6 deaths/1,000 live births
[see also: Infant mortality rate - total country ranks ]
male: 3.9 deaths/1,000 live births
[see also: Infant mortality rate - male country ranks ]
female: 3.4 deaths/1,000 live births
(2020 est.)
[see also: Infant mortality rate - female country ranks ]
country comparison to the world (CIA rank, may be based on non-current data):
196
Life expectancy at birth:
total population: 82.2 years
[see also: Life expectancy at birth - total population country ranks ]
male: 79.7 years
[see also: Life expectancy at birth - male country ranks ]
female: 84.9 years
(2020 est.)
[see also: Life expectancy at birth - female country ranks ]
country comparison to the world (CIA rank, may be based on non-current data):
20
[See also: Healthy Life Expectancy ]
[See also: Health Performance ]
Total fertility rate:
1.67 children born/woman
(2020 est.)
country comparison to the world (CIA rank, may be based on non-current data):
179
[see also: Total fertility rate country ranks ]
HIV/AIDS - adult prevalence rate:
NA
[see also: HIV/AIDS - adult prevalence rate country ranks ]
HIV/AIDS - people living with HIV/AIDS:
NA
[see also: HIV/AIDS - people living with HIV/AIDS country ranks ]
HIV/AIDS - deaths:
NA
[see also: HIV/AIDS - deaths country ranks ]
Education expenditures:
NA
[see also: Education expenditures country ranks ]
NOTE: 1) The information regarding Jersey on this page is re-published from the 2020 World Fact Book of the United States Central Intelligence Agency and other sources. No claims are made regarding the accuracy of Jersey People 2020 information contained here. All suggestions for corrections of any errors about Jersey People 2020 should be addressed to the CIA or the source cited on each page.
2) The rank that you see is the CIA reported rank, which may have the following issues:
a) They assign increasing rank number, alphabetically for countries with the same value of the ranked item, whereas we assign them the same rank.
b) The CIA sometimes assigns counterintuitive ranks. For example, it assigns unemployment rates in increasing order, whereas we rank them in decreasing order.
- Main Index
- 2020 Index
- Country Ranks
- Definitions
- Jersey Index 2020
- Jersey Main Index
- Introduction
- Geography
- Maps
- People
- Religion
- Government
- Gov. Leaders
- Flags
- Economy
- Energy
- Communications
- Transportation
- Airport Codes
- Military
- Transnational Issues
- Photos
- Advertise Here
- Feedback

This page was last modified 27-Jan-20