


Population:
51,433
(July 2020 est.)
country comparison to the world (CIA rank, may be based on non-current data):
210
[see also: Population country ranks ]
Nationality:
noun:
NA (US citizens)
adjective:
NA
Ethnic groups:
Asian 50% (includes Filipino 35.3%, Chinese 6.8%, Korean 4.2%, and other Asian 3.7%), Native Hawaiian or other Pacific Islander 34.9% (includes Chamorro 23.9%, Carolinian 4.6%, and other Native Hawaiian or Pacific Islander 6.4%), other 2.5%, two or more ethnicities or races 12.7%
(2010 est.)
Languages:
Philippine languages 32.8%, Chamorro (official) 24.1%, English (official) 17%, other Pacific island languages 10.1%, Chinese 6.8%, other Asian languages 7.3%, other 1.9%
(2010 est.)
Religions:
Christian (Roman Catholic majority, although traditional beliefs and taboos may still be found)
Age structure:
0-14 years: 25.02%
(male 6,937/female 5,934)
[see also: Age structure - 0-14 years country ranks ]
15-24 years: 16.28%
(male 4,518/female 3,857)
[see also: Age structure - 15-24 years country ranks ]
25-54 years: 37.44%
(male 9,934/female 9,325)
[see also: Age structure - 25-54 years country ranks ]
55-64 years: 14.01%
(male 3,921/female 3,286)
[see also: Age structure - 55-64 years country ranks ]
65 years and over: 7.23%
(male 1,988/female 1,733)
(2020 est.)
[see also: Age structure - 65 years and over country ranks ]
population pyramid:
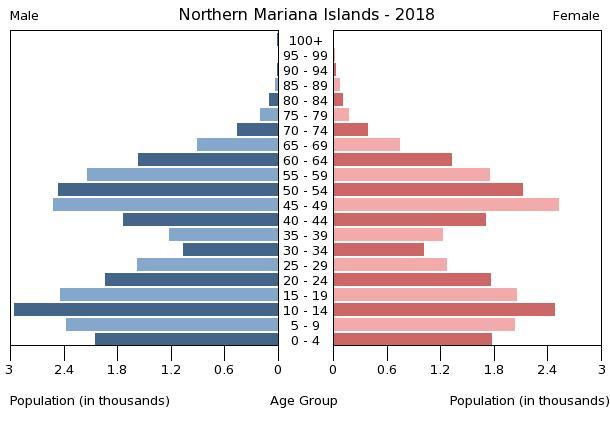
This is the population pyramid for the Northern Mariana Islands. A population pyramid illustrates the age and sex structure of a country's population and may provide insights about political and social stability, as well as economic development. The population is distributed along the horizontal axis, with males shown on the left and females on the right. The male and female populations are broken down into 5-year age groups represented as horizontal bars along the vertical axis, with the youngest age groups at the bottom and the oldest at the top. The shape of the population pyramid gradually evolves over time based on fertility, mortality, and international migration trends.
For additional information, please see the entry for Population pyramid on the Definitions and Notes page under the References tab.
Median age:
total: 32.8 years
[see also: Median age - total country ranks ]
male: 31.8 years
[see also: Median age - male country ranks ]
female: 34.1 years
(2020 est.)
[see also: Median age - female country ranks ]
country comparison to the world (CIA rank, may be based on non-current data):
105
Population growth rate:
-0.55%
(2020 est.)
country comparison to the world (CIA rank, may be based on non-current data):
226
[see also: Population growth rate country ranks ]
Birth rate:
15.1 births/1,000 population
(2020 est.)
country comparison to the world (CIA rank, may be based on non-current data):
118
[see also: Birth rate country ranks ]
Death rate:
5.3 deaths/1,000 population
(2020 est.)
country comparison to the world (CIA rank, may be based on non-current data):
192
[see also: Death rate country ranks ]
Net migration rate:
-15.4 migrant(s)/1,000 population
(2020 est.)
country comparison to the world (CIA rank, may be based on non-current data):
223
[see also: Net migration rate country ranks ]
Population distribution:
approximately 90% of the population lives on the island of Saipan
Urbanization:
urban population: 91.7% of total population
(2019)
[see also: Urbanization - urban population country ranks ]
rate of urbanization: 0.29% annual rate of change
(2015-20 est.)
[see also: Urbanization - rate of urbanization country ranks ]
Major urban areas - population:
51,000 SAIPAN (capital)
(2018)
Sex ratio:
at birth: 1.16 male(s)/female
(2020 est.)
[see also: Sex ratio - at birth country ranks ]
0-14 years: 1.17 male(s)/female
(2020 est.)
[see also: Sex ratio - 0-14 years country ranks ]
15-24 years: 1.17 male(s)/female
(2020 est.)
[see also: Sex ratio - 15-24 years country ranks ]
25-54 years: 1.07 male(s)/female
(2020 est.)
[see also: Sex ratio - 25-54 years country ranks ]
55-64 years: 1.19 male(s)/female
(2020 est.)
[see also: Sex ratio - 55-64 years country ranks ]
65 years and over: 1.15 male(s)/female
(2020 est.)
[see also: Sex ratio - 65 years and over country ranks ]
total population: 113.1 male(s)/female
(2020 est.)
[see also: Sex ratio country ranks ]
Infant mortality rate:
total: 11.5 deaths/1,000 live births
[see also: Infant mortality rate - total country ranks ]
male: 13.7 deaths/1,000 live births
[see also: Infant mortality rate - male country ranks ]
female: 9 deaths/1,000 live births
(2020 est.)
[see also: Infant mortality rate - female country ranks ]
country comparison to the world (CIA rank, may be based on non-current data):
114
Life expectancy at birth:
total population: 76.1 years
[see also: Life expectancy at birth - total population country ranks ]
male: 74 years
[see also: Life expectancy at birth - male country ranks ]
female: 78.5 years
(2020 est.)
[see also: Life expectancy at birth - female country ranks ]
country comparison to the world (CIA rank, may be based on non-current data):
105
[See also: Healthy Life Expectancy ]
[See also: Health Performance ]
Total fertility rate:
2.7 children born/woman
(2020 est.)
country comparison to the world (CIA rank, may be based on non-current data):
65
[see also: Total fertility rate country ranks ]
Drinking water source:
improved:
urban: 97.5% of population
[see also: Drinking water source - improved - urban country ranks ]
rural: 97.5% of population
[see also: Drinking water source - improved - rural country ranks ]
total: 97.5% of population
unimproved:
urban: 2.5% of population
rural: 2.5% of population
total: 2.5% of population
(2015 est.)
Physicians density:
Sanitation facility access:
improved:
urban: 79.7% of population
(2015 est.)
rural: 79.7% of population
(2015 est.)
total: 79.7% of population
(2015 est.)
unimproved:
urban: 20.3% of population
(2015 est.)
rural: 20.3% of population
(2015 est.)
total: 20.3% of population
(2015 est.)
[see also: Physicians density country ranks ]
HIV/AIDS - adult prevalence rate:
NA
[see also: HIV/AIDS - adult prevalence rate country ranks ]
HIV/AIDS - people living with HIV/AIDS:
NA
[see also: HIV/AIDS - people living with HIV/AIDS country ranks ]
HIV/AIDS - deaths:
NA
[see also: HIV/AIDS - deaths country ranks ]
Education expenditures:
NA
[see also: Education expenditures country ranks ]
NOTE: 1) The information regarding Northern Mariana Islands on this page is re-published from the 2020 World Fact Book of the United States Central Intelligence Agency and other sources. No claims are made regarding the accuracy of Northern Mariana Islands People 2020 information contained here. All suggestions for corrections of any errors about Northern Mariana Islands People 2020 should be addressed to the CIA or the source cited on each page.
2) The rank that you see is the CIA reported rank, which may have the following issues:
a) They assign increasing rank number, alphabetically for countries with the same value of the ranked item, whereas we assign them the same rank.
b) The CIA sometimes assigns counterintuitive ranks. For example, it assigns unemployment rates in increasing order, whereas we rank them in decreasing order.
- Main Index
- 2020 Index
- Country Ranks
- Definitions
- Northern Mariana Islands Index 2020
- Northern Mariana Islands Main Index
- Introduction
- Geography
- Maps
- People
- Religion
- Government
- Gov. Leaders
- Flags
- Economy
- Energy
- Communications
- Transportation
- Airport Codes
- Military
- Transnational Issues
- Photos
- Advertise Here
- Feedback

This page was last modified 27-Jan-20