


Population:
106,235
(July 2020 est.)
country comparison to the world (CIA rank, may be based on non-current data):
192
[see also: Population country ranks ]
Nationality:
noun:
Virgin Islander(s) (US citizens)
adjective:
Virgin Islander
Ethnic groups:
black 76%, white 15.6%, Asian 1.4%, other 4.9%, mixed 2.1%
(2010 est.)
note: 17.4% self-identify as latino
Languages:
English 71.6%, Spanish or Spanish Creole 17.2%, French or French Creole 8.6%, other 2.5%
(2010 est.)
Religions:
Protestant 59% (Baptist 42%, Episcopalian 17%), Roman Catholic 34%, other 7%
Age structure:
0-14 years: 19.9%
(male 10,820/female 10,322)
[see also: Age structure - 0-14 years country ranks ]
15-24 years: 10.32%
(male 5,329/female 5,632)
[see also: Age structure - 15-24 years country ranks ]
25-54 years: 36.43%
(male 18,127/female 20,576)
[see also: Age structure - 25-54 years country ranks ]
55-64 years: 14.16%
(male 7,177/female 7,864)
[see also: Age structure - 55-64 years country ranks ]
65 years and over: 19.19%
(male 9,153/female 11,235)
(2020 est.)
[see also: Age structure - 65 years and over country ranks ]
population pyramid:
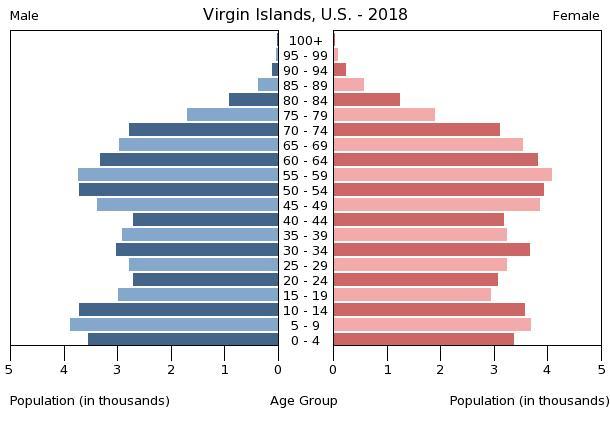
This is the population pyramid for the Virgin Islands. A population pyramid illustrates the age and sex structure of a country's population and may provide insights about political and social stability, as well as economic development. The population is distributed along the horizontal axis, with males shown on the left and females on the right. The male and female populations are broken down into 5-year age groups represented as horizontal bars along the vertical axis, with the youngest age groups at the bottom and the oldest at the top. The shape of the population pyramid gradually evolves over time based on fertility, mortality, and international migration trends.
For additional information, please see the entry for Population pyramid on the Definitions and Notes page under the References tab.
Dependency ratios:
total dependency ratio: 60.8
(2015 est.)
[see also: Dependency ratios - total dependency ratio country ranks ]
youth dependency ratio: 32.8
(2015 est.)
[see also: Dependency ratios - youth dependency ratio country ranks ]
elderly dependency ratio: 28
(2015 est.)
[see also: Dependency ratios - elderly dependency ratio country ranks ]
potential support ratio: 3.6
(2015 est.)
[see also: Dependency ratios - potential support ratio country ranks ]
Median age:
total: 41.8 years
[see also: Median age - total country ranks ]
male: 40.6 years
[see also: Median age - male country ranks ]
female: 42.8 years
(2020 est.)
[see also: Median age - female country ranks ]
country comparison to the world (CIA rank, may be based on non-current data):
42
Population growth rate:
-0.37%
(2020 est.)
country comparison to the world (CIA rank, may be based on non-current data):
223
[see also: Population growth rate country ranks ]
Birth rate:
12.1 births/1,000 population
(2020 est.)
country comparison to the world (CIA rank, may be based on non-current data):
162
[see also: Birth rate country ranks ]
Death rate:
8.5 deaths/1,000 population
(2020 est.)
country comparison to the world (CIA rank, may be based on non-current data):
74
[see also: Death rate country ranks ]
Net migration rate:
-7.5 migrant(s)/1,000 population
(2020 est.)
country comparison to the world (CIA rank, may be based on non-current data):
211
[see also: Net migration rate country ranks ]
Population distribution:
while overall population density throughout the islands is relatively low, concentrations appear around Charlotte Amalie on St. Thomas and Christiansted on St. Croix
Urbanization:
urban population: 95.8% of total population
(2019)
[see also: Urbanization - urban population country ranks ]
rate of urbanization: 0.1% annual rate of change
(2015-20 est.)
[see also: Urbanization - rate of urbanization country ranks ]
Major urban areas - population:
52,000 CHARLOTTE AMALIE (capital)
(2018)
Sex ratio:
at birth: 1.06 male(s)/female
(2020 est.)
[see also: Sex ratio - at birth country ranks ]
0-14 years: 1.05 male(s)/female
(2020 est.)
[see also: Sex ratio - 0-14 years country ranks ]
15-24 years: 0.95 male(s)/female
(2020 est.)
[see also: Sex ratio - 15-24 years country ranks ]
25-54 years: 0.88 male(s)/female
(2020 est.)
[see also: Sex ratio - 25-54 years country ranks ]
55-64 years: 0.91 male(s)/female
(2020 est.)
[see also: Sex ratio - 55-64 years country ranks ]
65 years and over: 0.81 male(s)/female
(2020 est.)
[see also: Sex ratio - 65 years and over country ranks ]
total population: 91 male(s)/female
(2020 est.)
[see also: Sex ratio country ranks ]
Infant mortality rate:
total: 7.4 deaths/1,000 live births
[see also: Infant mortality rate - total country ranks ]
male: 8.4 deaths/1,000 live births
[see also: Infant mortality rate - male country ranks ]
female: 6.3 deaths/1,000 live births
(2020 est.)
[see also: Infant mortality rate - female country ranks ]
country comparison to the world (CIA rank, may be based on non-current data):
159
Life expectancy at birth:
total population: 79.8 years
[see also: Life expectancy at birth - total population country ranks ]
male: 76.6 years
[see also: Life expectancy at birth - male country ranks ]
female: 83.2 years
(2020 est.)
[see also: Life expectancy at birth - female country ranks ]
country comparison to the world (CIA rank, may be based on non-current data):
51
[See also: Healthy Life Expectancy ]
[See also: Health Performance ]
Total fertility rate:
2.03 children born/woman
(2020 est.)
country comparison to the world (CIA rank, may be based on non-current data):
109
[see also: Total fertility rate country ranks ]
Drinking water source:
improved:
urban: 100% of population
[see also: Drinking water source - improved - urban country ranks ]
rural: 100% of population
[see also: Drinking water source - improved - rural country ranks ]
total: 100% of population
unimproved:
urban: 0% of population
rural: 0% of population
total: 0% of population
(2015 est.)
Sanitation facility access:
improved:
urban: 96.4% of population
(2015 est.)
[see also: Sanitation facility access - improved - urban country ranks ]
rural: 96.4% of population
(2015 est.)
[see also: Sanitation facility access - improved - rural country ranks ]
total: 96.4% of population
(2015 est.)
unimproved:
urban: 3.6% of population
(2015 est.)
rural: 3.6% of population
(2015 est.)
total: 3.6% of population
(2015 est.)
HIV/AIDS - adult prevalence rate:
NA
[see also: HIV/AIDS - adult prevalence rate country ranks ]
HIV/AIDS - people living with HIV/AIDS:
NA
[see also: HIV/AIDS - people living with HIV/AIDS country ranks ]
HIV/AIDS - deaths:
NA
[see also: HIV/AIDS - deaths country ranks ]
Major infectious diseases:
note: active local transmission of Zika virus by Aedes species mosquitoes has been identified in this country (as of August 2016); it poses an important risk (a large number of cases possible) among US citizens if bitten by an infective mosquito; other less common ways to get Zika are through sex, via blood transfusion, or during pregnancy, in which the pregnant woman passes Zika virus to her fetus
Education expenditures:
NA
[see also: Education expenditures country ranks ]
NOTE: 1) The information regarding Virgin Islands on this page is re-published from the 2020 World Fact Book of the United States Central Intelligence Agency and other sources. No claims are made regarding the accuracy of Virgin Islands People 2020 information contained here. All suggestions for corrections of any errors about Virgin Islands People 2020 should be addressed to the CIA or the source cited on each page.
2) The rank that you see is the CIA reported rank, which may have the following issues:
a) They assign increasing rank number, alphabetically for countries with the same value of the ranked item, whereas we assign them the same rank.
b) The CIA sometimes assigns counterintuitive ranks. For example, it assigns unemployment rates in increasing order, whereas we rank them in decreasing order.
- Main Index
- 2020 Index
- Country Ranks
- Definitions
- Virgin Islands Index 2020
- Virgin Islands Main Index
- Introduction
- History
- Geography
- Maps
- People
- Religion
- Government
- Gov. Leaders
- Flags
- Economy
- Energy
- Communications
- Transportation
- Airport Codes
- Military
- Transnational Issues
- Photos
- Advertise Here
- Feedback

This page was last modified 27-Jan-20