


Population:
7,503,828,180
(July 2018 est.)
top ten most populous countries (in millions): China 1379.3; India 1281.93; United States 326.63; Indonesia 260.58; Brazil 207.35; Pakistan 204.92; Nigeria 190.63; Bangladesh 157.83; Russia 142.26; Japan 126.45;
ten least populous countries: Holy See (Vatican City) 1,000; Montserrat 5,292; Saint Pierre and Miquelon 5,533; Saint Barthelemy 7,184; Saint Helena, Ascension, and Tristan de Cunha 7,828; Cook Islands 9,290; Tuvalu 11,052; Nauru 11,359; Wallis and Futuna 15,714; Anguilla 17,087;
ten most densely populated countries (population per sq km): Macau 21,346; Monaco 15,322; Singapore 8,572; Hong Kong 6,702; Gaza Strip 4,987; Gibraltar 4,523; Bahrain 1,857; Maldives 1,318; Malta 1,317; Bermuda 1,312;
ten least densely populated countries (population per sq km): Greenland less than 1; Mongolia 2; Western Sahara 2.3; Australia 3; Namibia 3; Iceland 3.4; Mauritania 3.6; Guyana 3.7; Libya 3.8; Suriname 3.8
[see also: Population country ranks ]
[see also: Population country ranks ]
most-spoken language: English 15.1%, Mandarin Chinese 14.9%, Hindi 8.2%, Spanish 7.1%, French 3.7%, Arabic 3.7%, Bengali 3.5%, Russian 3.4%, Portuguese 3.1%, Indonesian 2.7% (2019 est.)
most-spoken first language: Mandarin Chinese 12.3%, Spanish 6%, English 5.1%, Arabic 5.1%, Hindi 3.5%, Bengali 3.3%, Portuguese 3%, Russian 2.1%, Japanese 1.7%, Punjabi, Western 1.3%, Javanese 1.1% (2018 est.)
note 1: the six UN languages - Arabic, Chinese (Mandarin), English, French, Russian, and Spanish (Castilian) - are the mother tongue or second language of about 45% of the world's population, and are the official languages in more than half the states in the world; some 400 languages have more than a million first-language speakers (2018)
note 2: all told, there are estimated to be just over 7,100 languages spoken in the world; approximately 80% of these languages are spoken by less than 100,000 people; about 150 languages are spoken by less than 10 people; communities that are isolated from each other in mountainous regions often develop multiple languages; Papua New Guinea, for example, boasts about 840 separate languages (2019)
note 3: approximately 2,300 languages are spoken in Asia, 2,140, in Africa, 1,310 in the Pacific, 1,060 in the Americas, and 290 in Europe (2019)
Christian 31.4%, Muslim 23.2%, Hindu 15%, Buddhist 7.1%, folk religions 5.9%, Jewish 0.2%, other 0.8%, unaffiliated 16.4%
Age structure:
0-14 years: 25.29%
(male 981,129,427/female 916,864,766)
[see also: Age structure - 0-14 years country ranks ]
15-24 years: 15.77%
(male 611,245,863/female 572,115,168)
[see also: Age structure - 15-24 years country ranks ]
25-54 years: 41.03%
(male 1,559,197,242/female 1,519,386,627)
[see also: Age structure - 25-54 years country ranks ]
55-64 years: 8.84%
(male 324,134,030/female 339,551,038)
[see also: Age structure - 55-64 years country ranks ]
65 years and over: 9.06%
(male 303,788,086/female 376,415,933)
(2018 est.)
[see also: Age structure - 65 years and over country ranks ]
population pyramid:
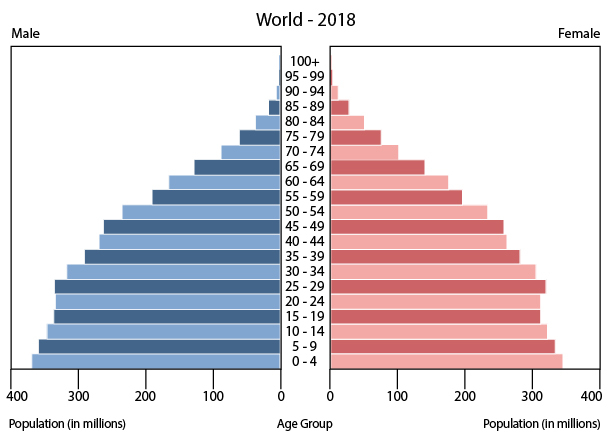
This is the population pyramid for the World. A population pyramid illustrates the age and sex structure of a country's population and may provide insights about political and social stability, as well as economic development. The population is distributed along the horizontal axis, with males shown on the left and females on the right. The male and female populations are broken down into 5-year age groups represented as horizontal bars along the vertical axis, with the youngest age groups at the bottom and the oldest at the top. The shape of the population pyramid gradually evolves over time based on fertility, mortality, and international migration trends.
For additional information, please see the entry for Population pyramid on the Definitions and Notes page under the References tab.
Dependency ratios:
total dependency ratio: 52.5
(2015 est.)
[see also: Dependency ratios - total dependency ratio country ranks ]
youth dependency ratio: 39.9
(2015 est.)
[see also: Dependency ratios - youth dependency ratio country ranks ]
elderly dependency ratio: 12.6
(2015 est.)
[see also: Dependency ratios - elderly dependency ratio country ranks ]
potential support ratio: 7.9
(2015 est.)
[see also: Dependency ratios - potential support ratio country ranks ]
Median age:
total: 30.6 years
(2018 est.)
[see also: Median age - total country ranks ]
male: 29.9 years
[see also: Median age - male country ranks ]
female: 31.4 years
[see also: Median age - female country ranks ]
Population growth rate:
1.05%
(2018 est.)
note: this rate results in about 149 net additions to the worldwide population every minute or 2.5 every second
[see also: Population growth rate country ranks ]
[see also: Population growth rate country ranks ]
Birth rate:
18.2 births/1,000 population
(2018 est.)
note: this rate results in about 259 worldwide births per minute or 4.3 births every second
[see also: Birth rate country ranks ]
[see also: Birth rate country ranks ]
Death rate:
7.7 deaths/1,000 population
(2018 est.)
note: this rate results in about 108 worldwide deaths per minute or 1.8 deaths every second
[see also: Death rate country ranks ]
[see also: Death rate country ranks ]
Population distribution:
six of the world's seven continents are widely and permanently inhabited; Asia is easily the most populous continent with about 60% of the world's population (China and India together account for over 35%); Africa comes in second with over 15% of the earth's populace, Europe has about 10%, North America 8%, South America almost 6%, and Oceania less than 1%; the harsh conditions on Antarctica prevent any permanent habitation
Urbanization:
urban population: 55.7% of total population
(2019)
[see also: Urbanization - urban population country ranks ]
rate of urbanization: 1.9% annual rate of change
(2015-20 est.)
[see also: Urbanization - rate of urbanization country ranks ]
Major urban areas - population:
ten largest urban agglomerations: Tokyo (Japan) - 37,435,000; New Delhi (India) - 29,399,000; Shanghai (China) - 26,317,000; Sao Paulo (Brazil) - 21,847,000; Mexico City (Mexico) - 21,672,000; Cairo (Egypt) - 20,485,000; Dhaka (Bangladesh) - 20,284,000; Mumbai (India) - 20,185,000; Beijing (China) - 20,035,000; Osaka (Japan) - 19,223,000
(2019)
ten largest urban agglomerations, by continent:
Africa - Cairo (Egypt) - 20,485,000; Lagos (Nigeria) - 13,904,000; Kinshasha (DRC) - 13,743,000; Luanda (Angola) - 8,045,000; Dar Es Salaam (Tanzania) - 6,368,000; Khartoum (Sudan) - 5,678,000; Johannesburg (South Africa) - 5,635,000; Alexandria (Egypt) - 5,182,000; Abidjan (Cote d'Ivoire) - 5,059,000; Addis Ababa (Ethiopia) - 4,592,000
Asia - Tokyo (Japan) - 37,435,000; New Delhi (India) - 29,399,000; Shanghai (China) - 26,317,000; Dhaka (Bangladesh) - 20,284,000; Mumbai (India) - 20,185,000; Beijing (China) - 20,035,000; Osaka (Japan) - 19,223,000; Karachi (Pakistan) - 15,741,000; Chongqing (China) - 15,354,000; Istanbul (Turkey) - 14,968,000
Europe - Moscow (Russia) - 12,476,000; Paris (France) - 10,958,000; London (United Kingdom) - 9,177,000; Madrid (Spain) - 6,559,000; Barcelona (Spain) - 5,541,000, Saint Petersburg (Russia) - 5,427,000; Rome (Italy) - 4,234,000; Berlin (Germany) - 3,557,000; Athens (Greece) - 3,154,000; Milan (Italy) - 3,136,000
North America - Mexico City (Mexico) - 21,672,000; New York-Newark (United States) - 18,805,000; Los Angeles-Long Beach-Santa Ana (United States) - 12,448,000; Chicago (United States) - 8,862,000; Houston (United States) - 6,245,000; Dallas-Fort Worth (United States) - 6,201,000; Toronto (Canada) - 6,139,000; Miami (United States) - 6,079,000; Philadelphia (United States) - 5,705,000; Atlanta (United States) - 5,689,000
Oceania - Melbourne (Australia) - 4,870,000, Sydney (Australia) - 4,859,000; Brisbane (Australia) - 2,372,000; Perth (Australia) - 2,016,000; Auckland (New Zealand) - 1,582,000; Adelaide (Australia) - 1,328,000; Gold Coast-Tweed Head (Australia) - 687,000; Canberra (Australia) - 452,000; Newcastle-Maitland (Australia) - 447,000; Wellington (New Zealand) - 413,000
South America - Sao Paulo (Brazil) - 21,847,000; Buenos Aires (Argentina) - 15,057,000; Rio de Janeiro (Brazil) - 13,374,000; Bogota (Colombia) - 10,779,000; Lima (Peru) - 10,555,000; Santiago (Chile) - 6,724,000; Belo Horizonte (Brazil) - 6,028,000; Brasilia (Brazil) - 4,559,000; Porto Alegre (Brazil) - 4,115,000; Recife (Brazil) - 4,078,000 (2019)
Sex ratio:
at birth: 1.07 male(s)/female
[see also: Sex ratio - at birth country ranks ]
0-14 years: 1.07 male(s)/female
[see also: Sex ratio - 0-14 years country ranks ]
15-24 years: 1.07 male(s)/female
[see also: Sex ratio - 15-24 years country ranks ]
25-54 years: 1.03 male(s)/female
[see also: Sex ratio - 25-54 years country ranks ]
55-64 years: 0.95 male(s)/female
[see also: Sex ratio - 55-64 years country ranks ]
65 years and over: 0.81 male(s)/female
[see also: Sex ratio - 65 years and over country ranks ]
total population: 1.01 male(s)/female
(2018 est.)
[see also: Sex ratio country ranks ]
[see also: Sex ratio country ranks ]
Maternal mortality rate:
211 deaths/100,000 live births
(2017 est.)
[see also: Maternal mortality rate country ranks ]
[see also: Maternal mortality rate country ranks ]
Infant mortality rate:
total: 32 deaths/1,000 live births
(2018 est.)
[see also: Infant mortality rate - total country ranks ]
male: 34 deaths/1,000 live births
[see also: Infant mortality rate - male country ranks ]
female: 29.9 deaths/1,000 live births
[see also: Infant mortality rate - female country ranks ]
Life expectancy at birth:
total population: 69.8 years
(2018 est.)
[see also: Life expectancy at birth - total population country ranks ]
male: 67.8 years
[see also: Life expectancy at birth - male country ranks ]
female: 72 years
[See also: Healthy Life Expectancy ]
[See also: Health Performance ]
Total fertility rate:
2.42 children born/woman
(2018 est.)
[see also: Total fertility rate country ranks ]
[see also: Total fertility rate country ranks ]
Drinking water source:
improved:
urban: 96.5% of population
[see also: Drinking water source - improved - urban country ranks ]
rural: 84.7% of population
[see also: Drinking water source - improved - rural country ranks ]
total: 91.1% of population
unimproved:
urban: 3.5% of population
rural: 15.3% of population
total: 8.9% of population
(2015 est.)
Current Health Expenditure:
10%
(2016)
[see also: Current Health Expenditure country ranks ]
Sanitation facility access:
improved:
urban: 82.3% of population
(2015 est.)
[see also: Sanitation facility access - improved - urban country ranks ]
rural: 50.5% of population
(2015 est.)
[see also: Sanitation facility access - improved - rural country ranks ]
total: 67.7% of population
(2015 est.)
unimproved:
urban: 17.7% of population
(2015 est.)
rural: 49.5% of population
(2015 est.)
total: 32.3% of population
(2015 est.)
HIV/AIDS - adult prevalence rate:
0.8%
(2018 est.)
[see also: HIV/AIDS - adult prevalence rate country ranks ]
[see also: HIV/AIDS - adult prevalence rate country ranks ]
HIV/AIDS - people living with HIV/AIDS:
37.9 million
(2018 est.)
[see also: HIV/AIDS - people living with HIV/AIDS country ranks ]
[see also: HIV/AIDS - people living with HIV/AIDS country ranks ]
HIV/AIDS - deaths:
770,000
(2018 est.)
[see also: HIV/AIDS - deaths country ranks ]
[see also: HIV/AIDS - deaths country ranks ]
Obesity - adult prevalence rate:
Education expenditures:
NA
[see also: Obesity - adult prevalence rate country ranks ]
[see also: Obesity - adult prevalence rate country ranks ]
Literacy:
definition:
age 15 and over can read and write
total population: 86.2%
[see also: Literacy - total population country ranks ]
male: 89.8%
[see also: Literacy - male country ranks ]
female: 82.6%
(2016 est.)
note: more than three-quarters of the world's 750 million illiterate adults are found in South Asia and sub-Saharan Africa; of all the illiterate adults in the world, almost two-thirds are women (2016)
School life expectancy (primary to tertiary education):
total: 12 years
[see also: School life expectancy (primary to tertiary education) - total country ranks ]
male: 12 years
[see also: School life expectancy (primary to tertiary education) - male country ranks ]
female: 12 years
[see also: School life expectancy (primary to tertiary education) - male country ranks ]
(2017)
NOTE: 1) The information regarding World on this page is re-published from the 2020 World Fact Book of the United States Central Intelligence Agency and other sources. No claims are made regarding the accuracy of World People 2020 information contained here. All suggestions for corrections of any errors about World People 2020 should be addressed to the CIA or the source cited on each page.
2) The rank that you see is the CIA reported rank, which may have the following issues:
a) They assign increasing rank number, alphabetically for countries with the same value of the ranked item, whereas we assign them the same rank.
b) The CIA sometimes assigns counterintuitive ranks. For example, it assigns unemployment rates in increasing order, whereas we rank them in decreasing order.
- Main Index
- 2020 Index
- Definitions
- World Index 2020
- World Main Index
- Introduction
- Geography
- Maps
- People
- Religion
- Government
- Gov. Leaders
- Flags
- Economy
- Energy
- Communications
- Transportation
- Airport Codes
- Military
- Transnational Issues
- Photos
- Advertise Here
- Feedback

This page was last modified 27-Jan-20