19,079 (2023 est.)
noun: Anguillan(s)
adjective: Anguillan
African/Black 85.3%, Hispanic 4.9%, mixed 3.8%, White 3.2%, East Indian/Indian 1%, other 1.6%, unspecified 0.3% (2011 est.)
note: data represent population by ethnic origin
English (official)
Protestant 73.2% (includes Anglican 22.7%, Methodist 19.4%, Pentecostal 10.5%, Seventh Day Adventist 8.3%, Baptist 7.1%, Church of God 4.9%, Presbyterian 0.2%, Brethren 0.1%), Roman Catholic 6.8%, Jehovah's Witness 1.1%, other Christian 10.9%, other 3.2%, unspecified 0.3%, none 4.5% (2011 est.)
0-14 years: 21% (male 2,034/female 1,972)
15-64 years: 67.88% (male 5,896/female 7,055)
65 years and over: 11.12% (2023 est.) (male 1,037/female 1,085)
total dependency ratio: 38.6
youth dependency ratio: 24.4
elderly dependency ratio: 14.1
potential support ratio: 7.1 (2021)
total: 36.8 years (2023 est.)
male: 34.6 years
female: 38.6 years
1.77% (2023 est.)
11.9 births/1,000 population (2023 est.)
4.7 deaths/1,000 population (2023 est.)
10.5 migrant(s)/1,000 population (2023 est.)
most of the population is concentrated in The Valley in the center of the island; settlmement is fairly uniform in the southwest, but rather sparce in the northeast
urban population: 100% of total population (2023)
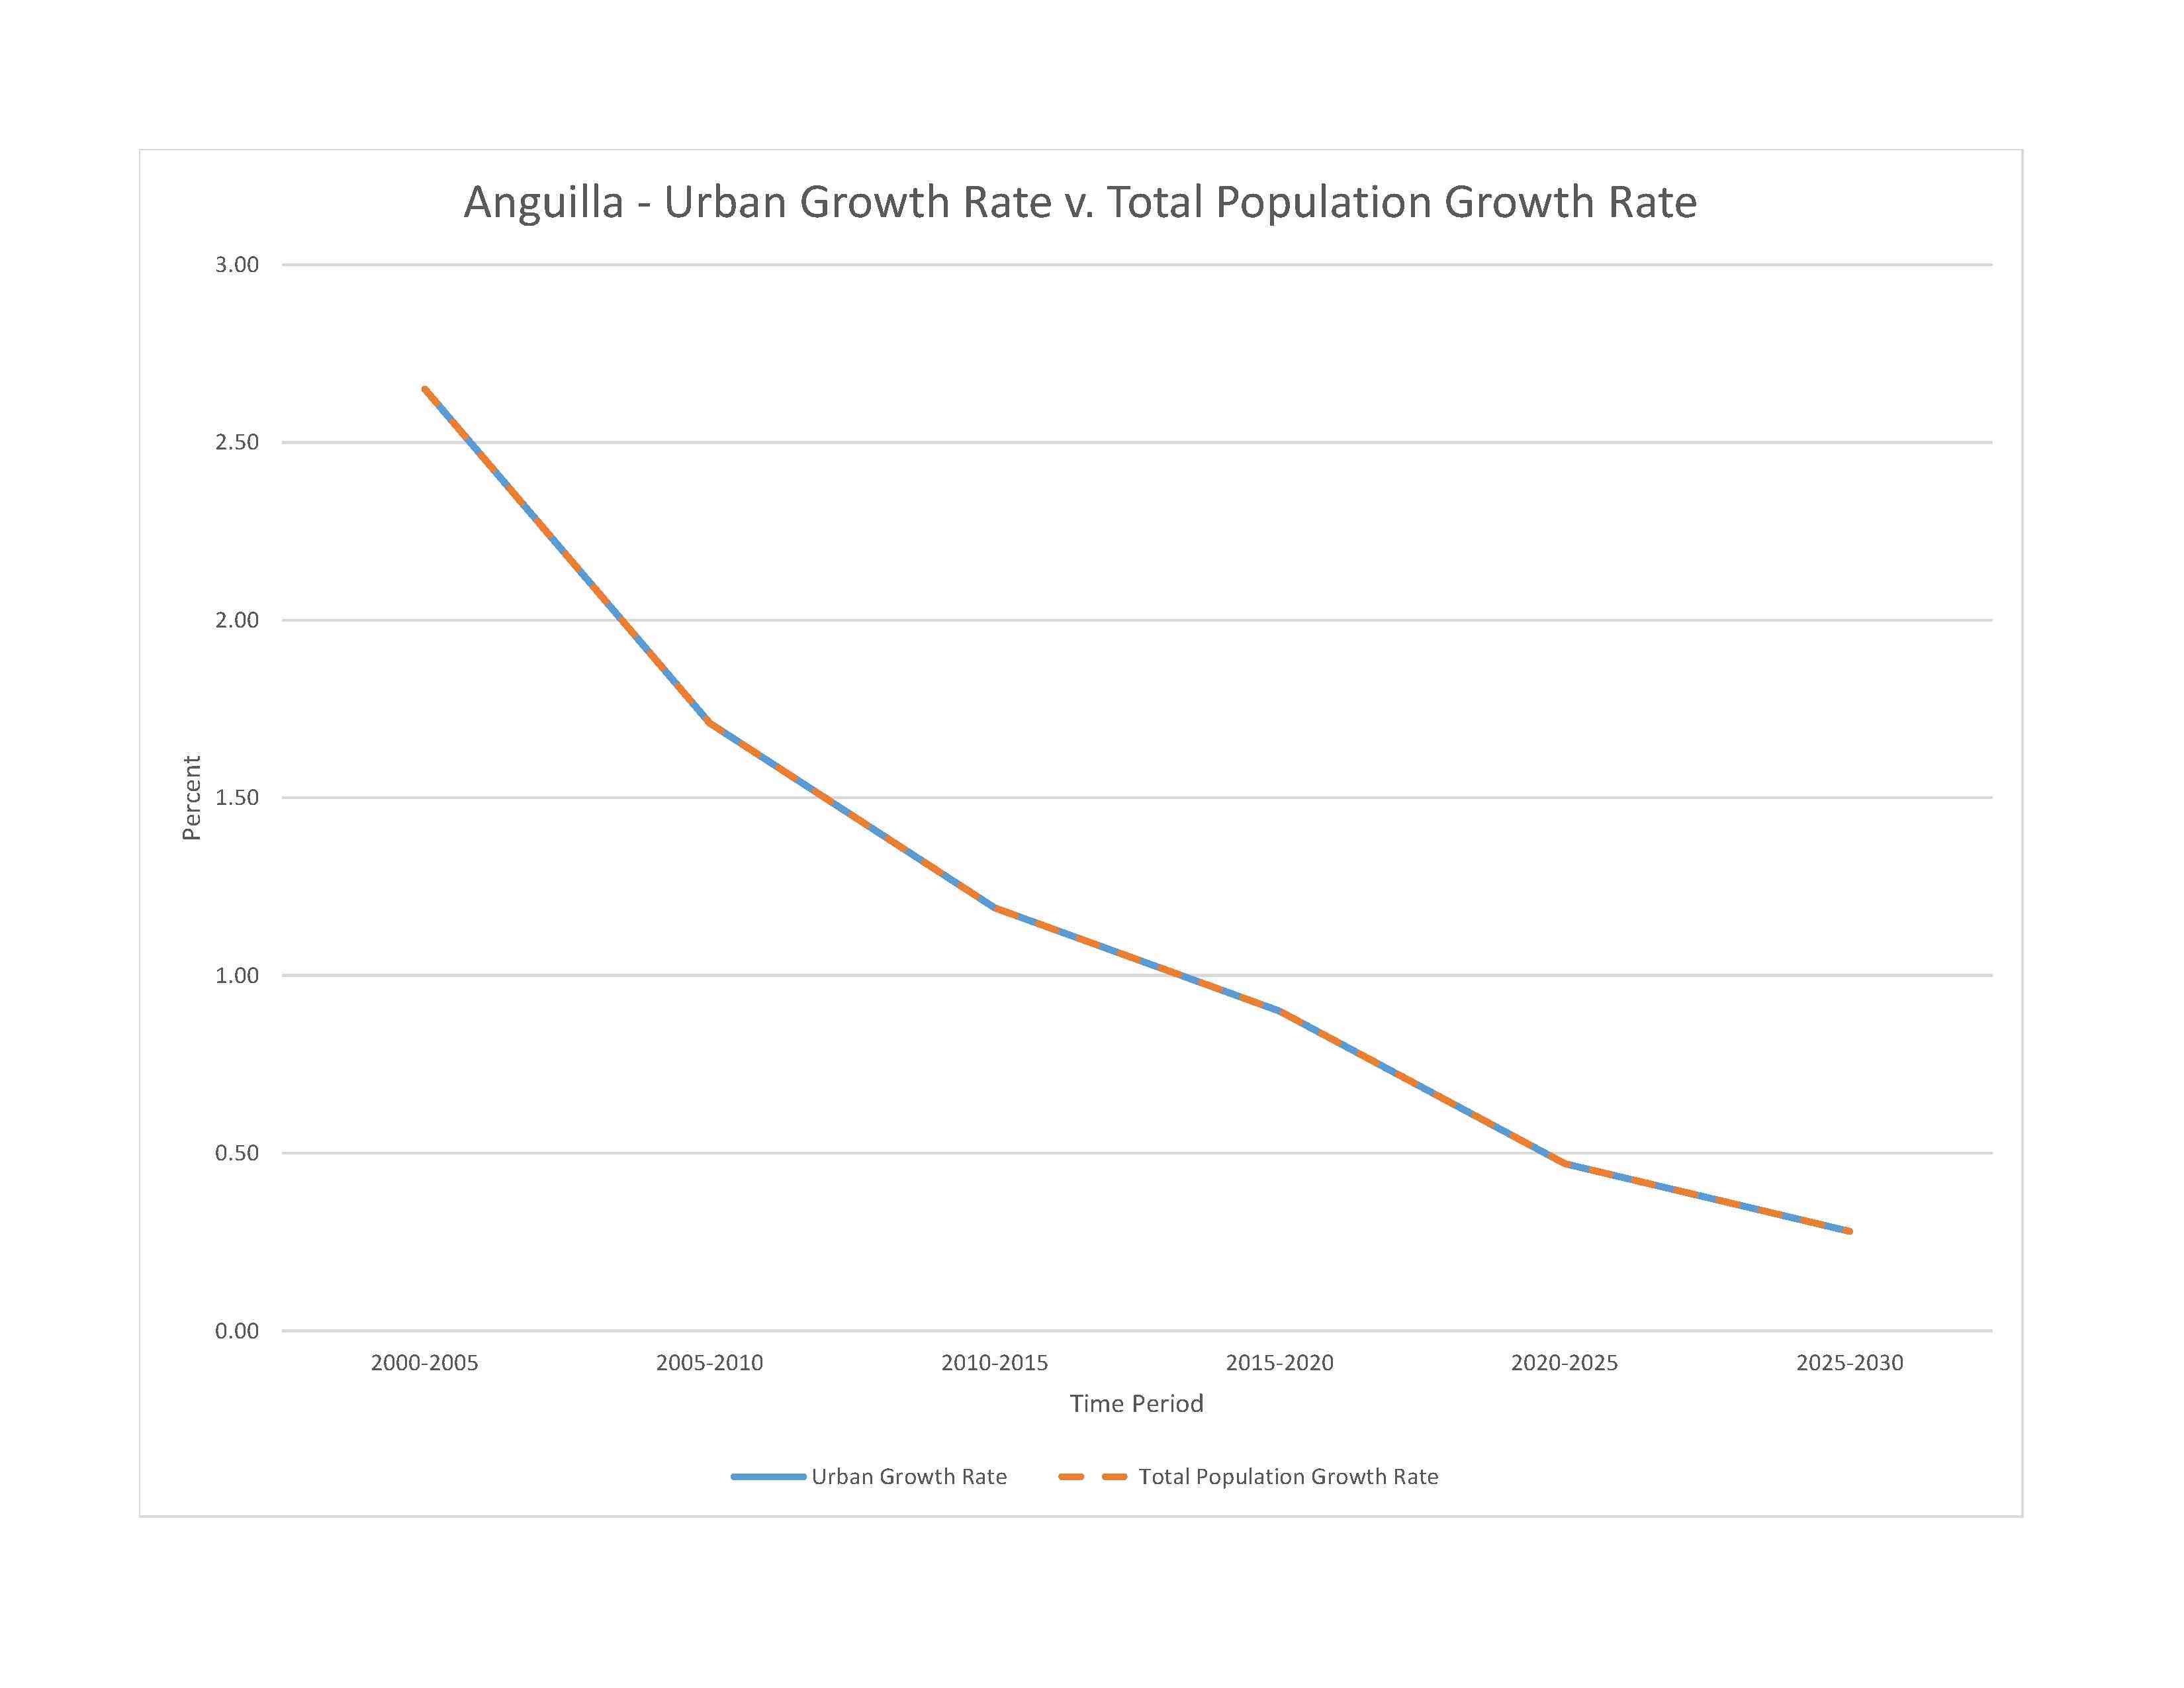
rate of urbanization: 0.47% annual rate of change (2020-25 est.)

1,000 THE VALLEY (capital) (2018)
at birth: 1.03 male(s)/female
0-14 years: 1.03 male(s)/female
15-64 years: 0.84 male(s)/female
65 years and over: 0.96 male(s)/female
total population: 0.89 male(s)/female (2023 est.)
total: 3 deaths/1,000 live births (2023 est.)
male: 3.9 deaths/1,000 live births
female: 2.1 deaths/1,000 live births
total population: 82.4 years (2023 est.)
male: 79.8 years
female: 85.1 years
1.72 children born/woman (2023 est.)
0.85 (2023 est.)
N/A
improved: urban: 97.5% of population
total: 97.5% of population
unimproved: urban: 2.5% of population
total: 2.5% of population (2017 est.)
N/A
N/A
improved: urban: 99.1% of population
total: 99.1% of population
unimproved: urban: 0.9% of population
total: 0.9% of population (2017 est.)
N/A
46.1% (2023 est.)
4% of GDP (2020 est.)
total population: NA
male: NA
female: NA
NOTE: The information regarding Anguilla on this page is re-published from the 2024 World Fact Book of the United States Central Intelligence Agency and other sources. No claims are made regarding the accuracy of Anguilla 2024 information contained here. All suggestions for corrections of any errors about Anguilla 2024 should be addressed to the CIA or the source cited on each page.
This page was last modified 04 May 24, Copyright © 2024 ITA all rights reserved.