soil degradation; desertification; water pollution from chemicals and pesticides; salination of fresh water; improper sewage treatment; water-borne disease; depletion and contamination of underground water resources
temperate, mild winters, dry and warm to hot summers
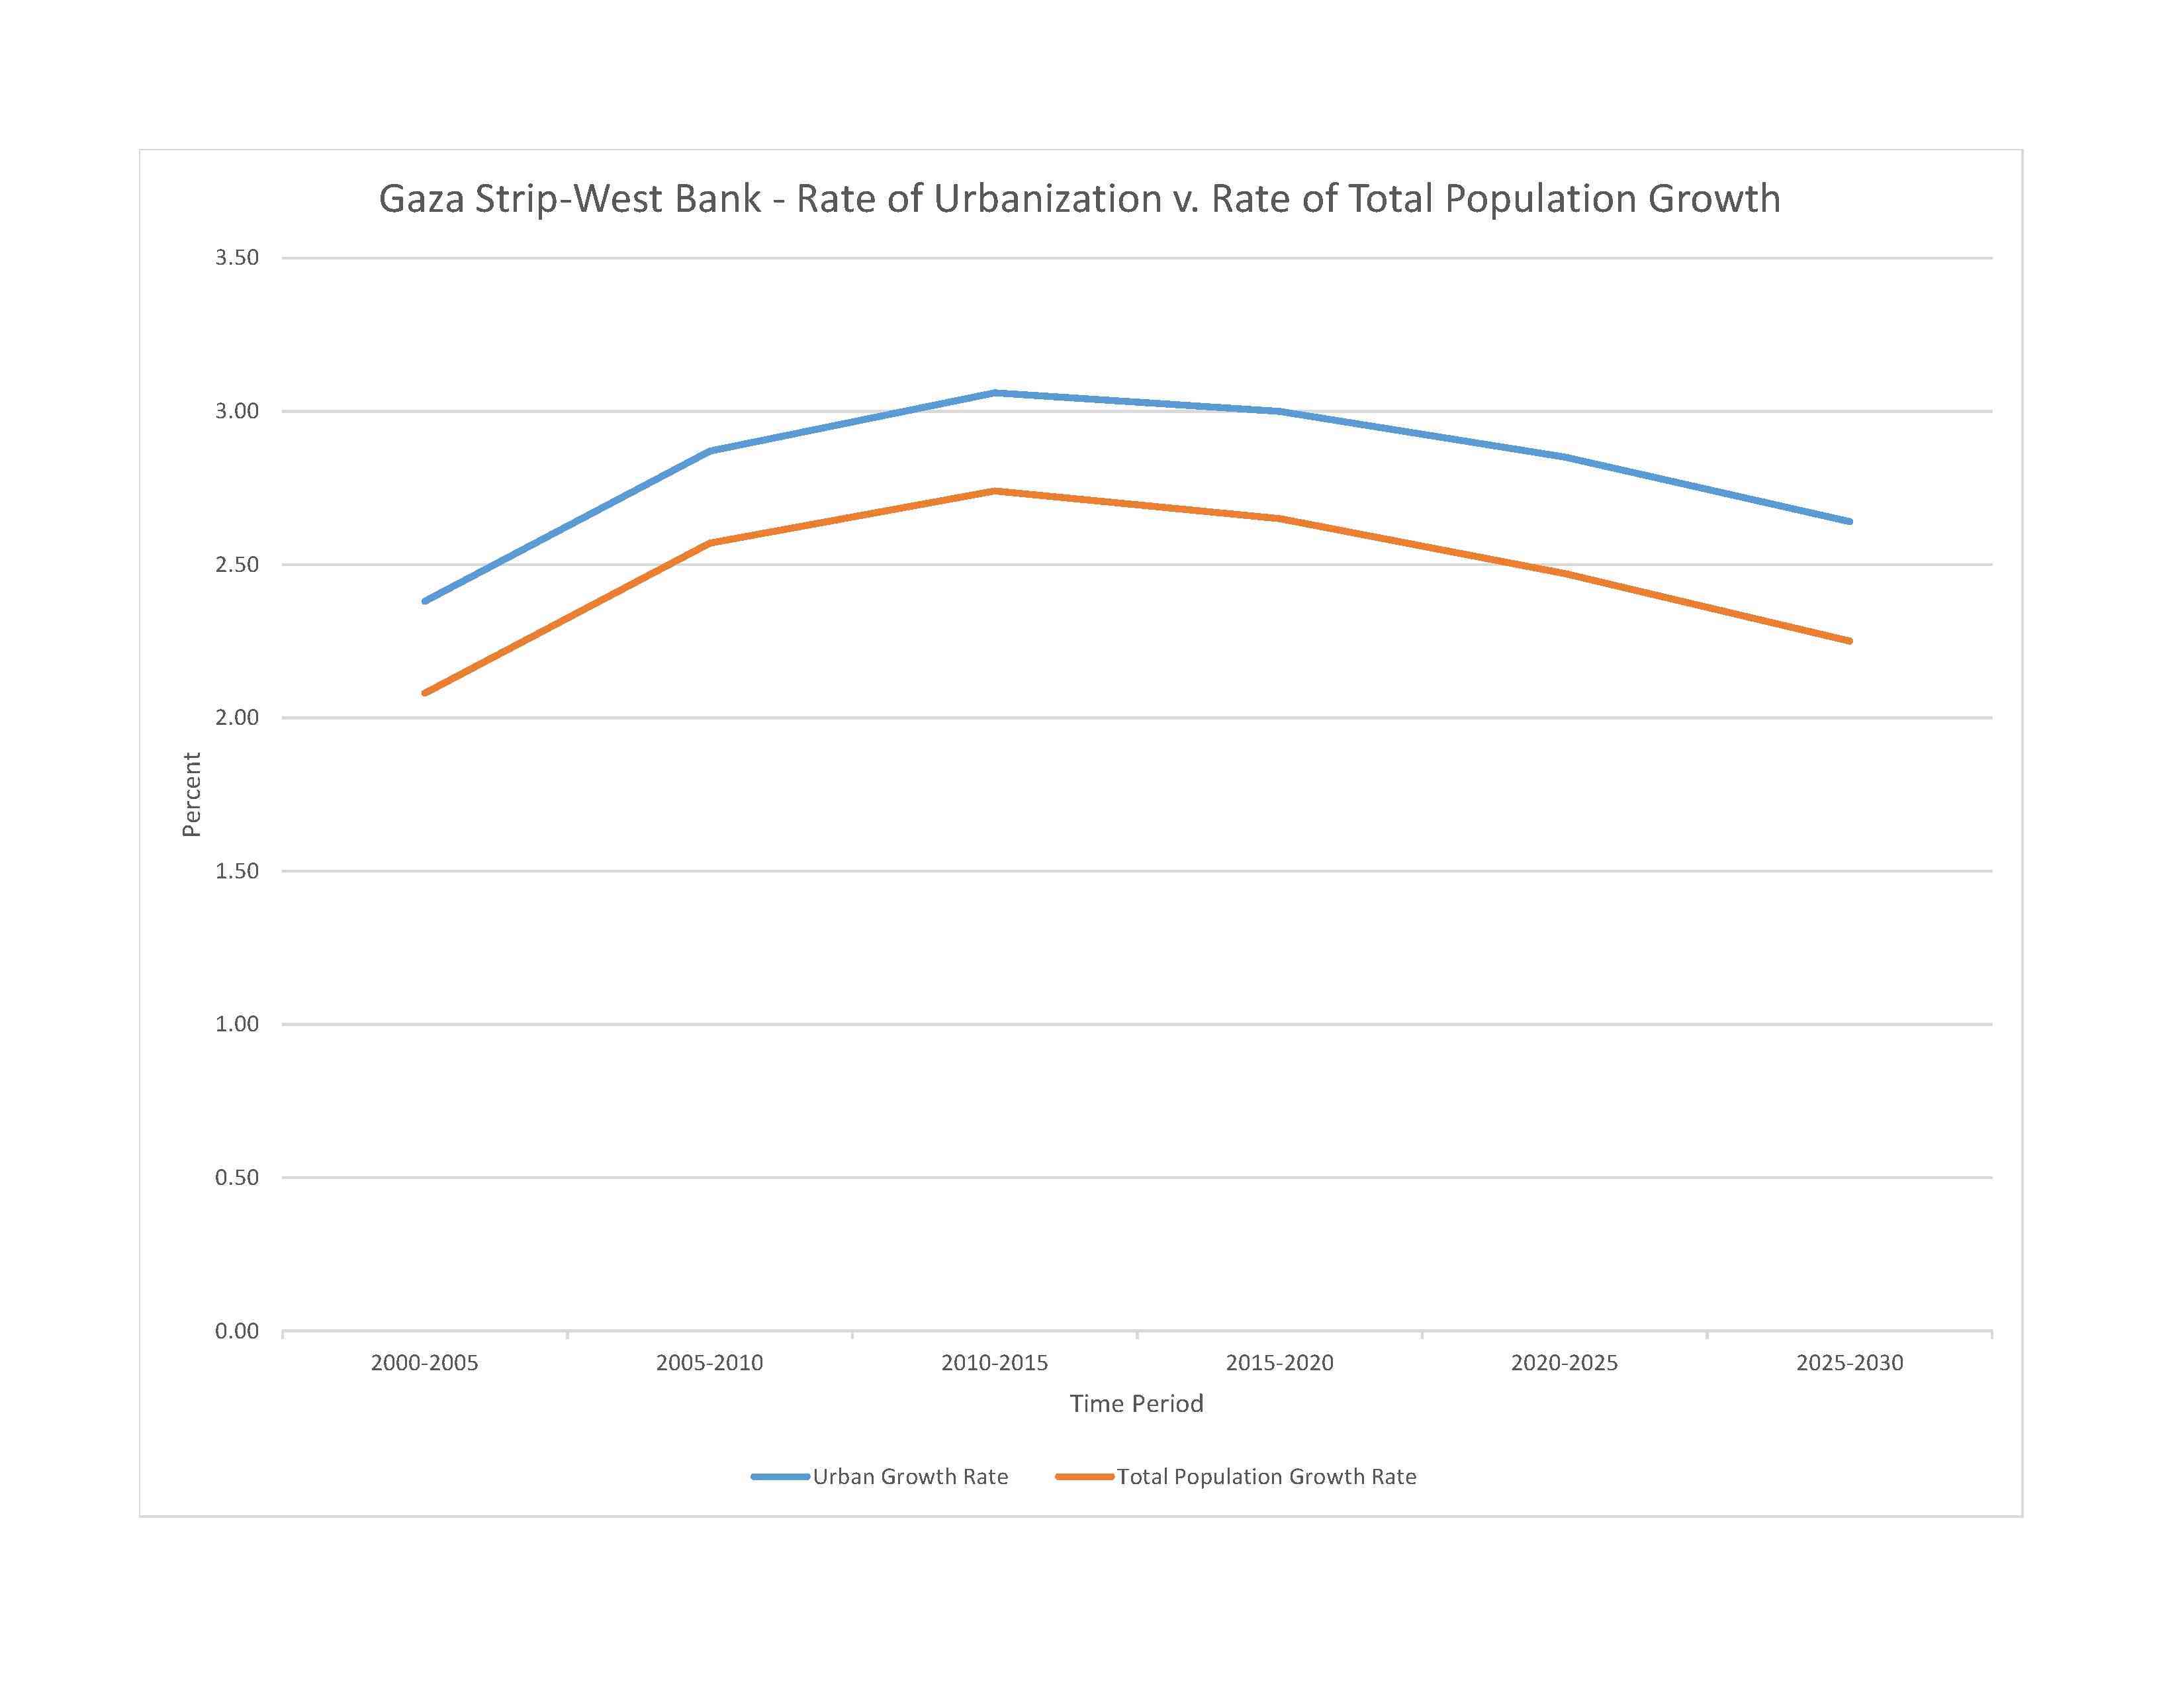
urban population: 77.6% of total population (2023)
rate of urbanization: 2.85% annual rate of change (2020-25 est.)
note: data represent Gaza Strip and the West Bank

0% of GDP (2018 est.)
particulate matter emissions: 30.82 micrograms per cubic meter (2019 est.)
carbon dioxide emissions: 3.23 megatons (2016 est.)
note: data represent combined total from the Gaza Strip and the West Bank.
municipal solid waste generated annually: 1.387 million tons (2016 est.)
municipal solid waste recycled annually: 6,935 tons (2013 est.)
percent of municipal solid waste recycled: 0.5% (2013 est.)
note: data represent combined total from the Gaza Strip and the West Bank.
municipal: 181.2 million cubic meters (2017 est.)
industrial: 32 million cubic meters (2017 est.)
agricultural: 162 million cubic meters (2017 est.)
note: data represent combined total from the Gaza Strip and the West Bank.
840 million cubic meters (2020 est.)
note: data represent combined total from the Gaza Strip and the West Bank.
NOTE: The information regarding Gaza Strip on this page is re-published from the 2024 World Fact Book of the United States Central Intelligence Agency and other sources. No claims are made regarding the accuracy of Gaza Strip 2024 information contained here. All suggestions for corrections of any errors about Gaza Strip 2024 should be addressed to the CIA or the source cited on each page.
This page was last modified 04 May 24, Copyright © 2024 ITA all rights reserved.