5,109,702 (2023 est.)
noun: New Zealander(s)
adjective: New Zealand
European 64.1%, Maori 16.5%, Chinese 4.9%, Indian 4.7%, Samoan 3.9%, Tongan 1.8%, Cook Islands Maori 1.7%, English 1.5%, Filipino 1.5%, New Zealander 1%, other 13.7% (2018 est.)
note: based on the 2018 census of the usually resident population; percentages add up to more than 100% because respondents were able to identify more than one ethnic group
English (de facto official) 95.4%, Maori (de jure official) 4%, Samoan 2.2%, Northern Chinese 2%, Hindi 1.5%, French 1.2%, Yue 1.1%, New Zealand Sign Language (de jure official) 0.5%, other or not stated 17.2% (2018 est.)
note: shares sum to 124.1% due to multiple responses on the 2018 census
Christian 37.3% (Catholic 10.1%, Anglican 6.8%, Presbyterian and Congregational 5.2%, Pentecostal 1.8%, Methodist 1.6%, Church of Jesus Christ 1.2%, other 10.7%), Hindu 2.7%, Maori 1.3%, Muslim, 1.3%, Buddhist 1.1%, other religion 1.6% (includes Judaism, Spiritualism and New Age religions, Baha'i, Asian religions other than Buddhism), no religion 48.6%, objected to answering 6.7% (2018 est.)
note: based on the 2018 census of the usually resident population; percentages add up to more than 100% because respondents were able to identify more than one religion
0-14 years: 19.15% (male 503,190/female 475,527)
15-64 years: 64.36% (male 1,661,312/female 1,627,304)
65 years and over: 16.49% (2023 est.) (male 394,339/female 448,030)
total dependency ratio: 53.4
youth dependency ratio: 29
elderly dependency ratio: 24.4
potential support ratio: 4.1 (2021 est.)
total: 37.7 years (2023 est.)
male: 36.9 years
female: 38.4 years
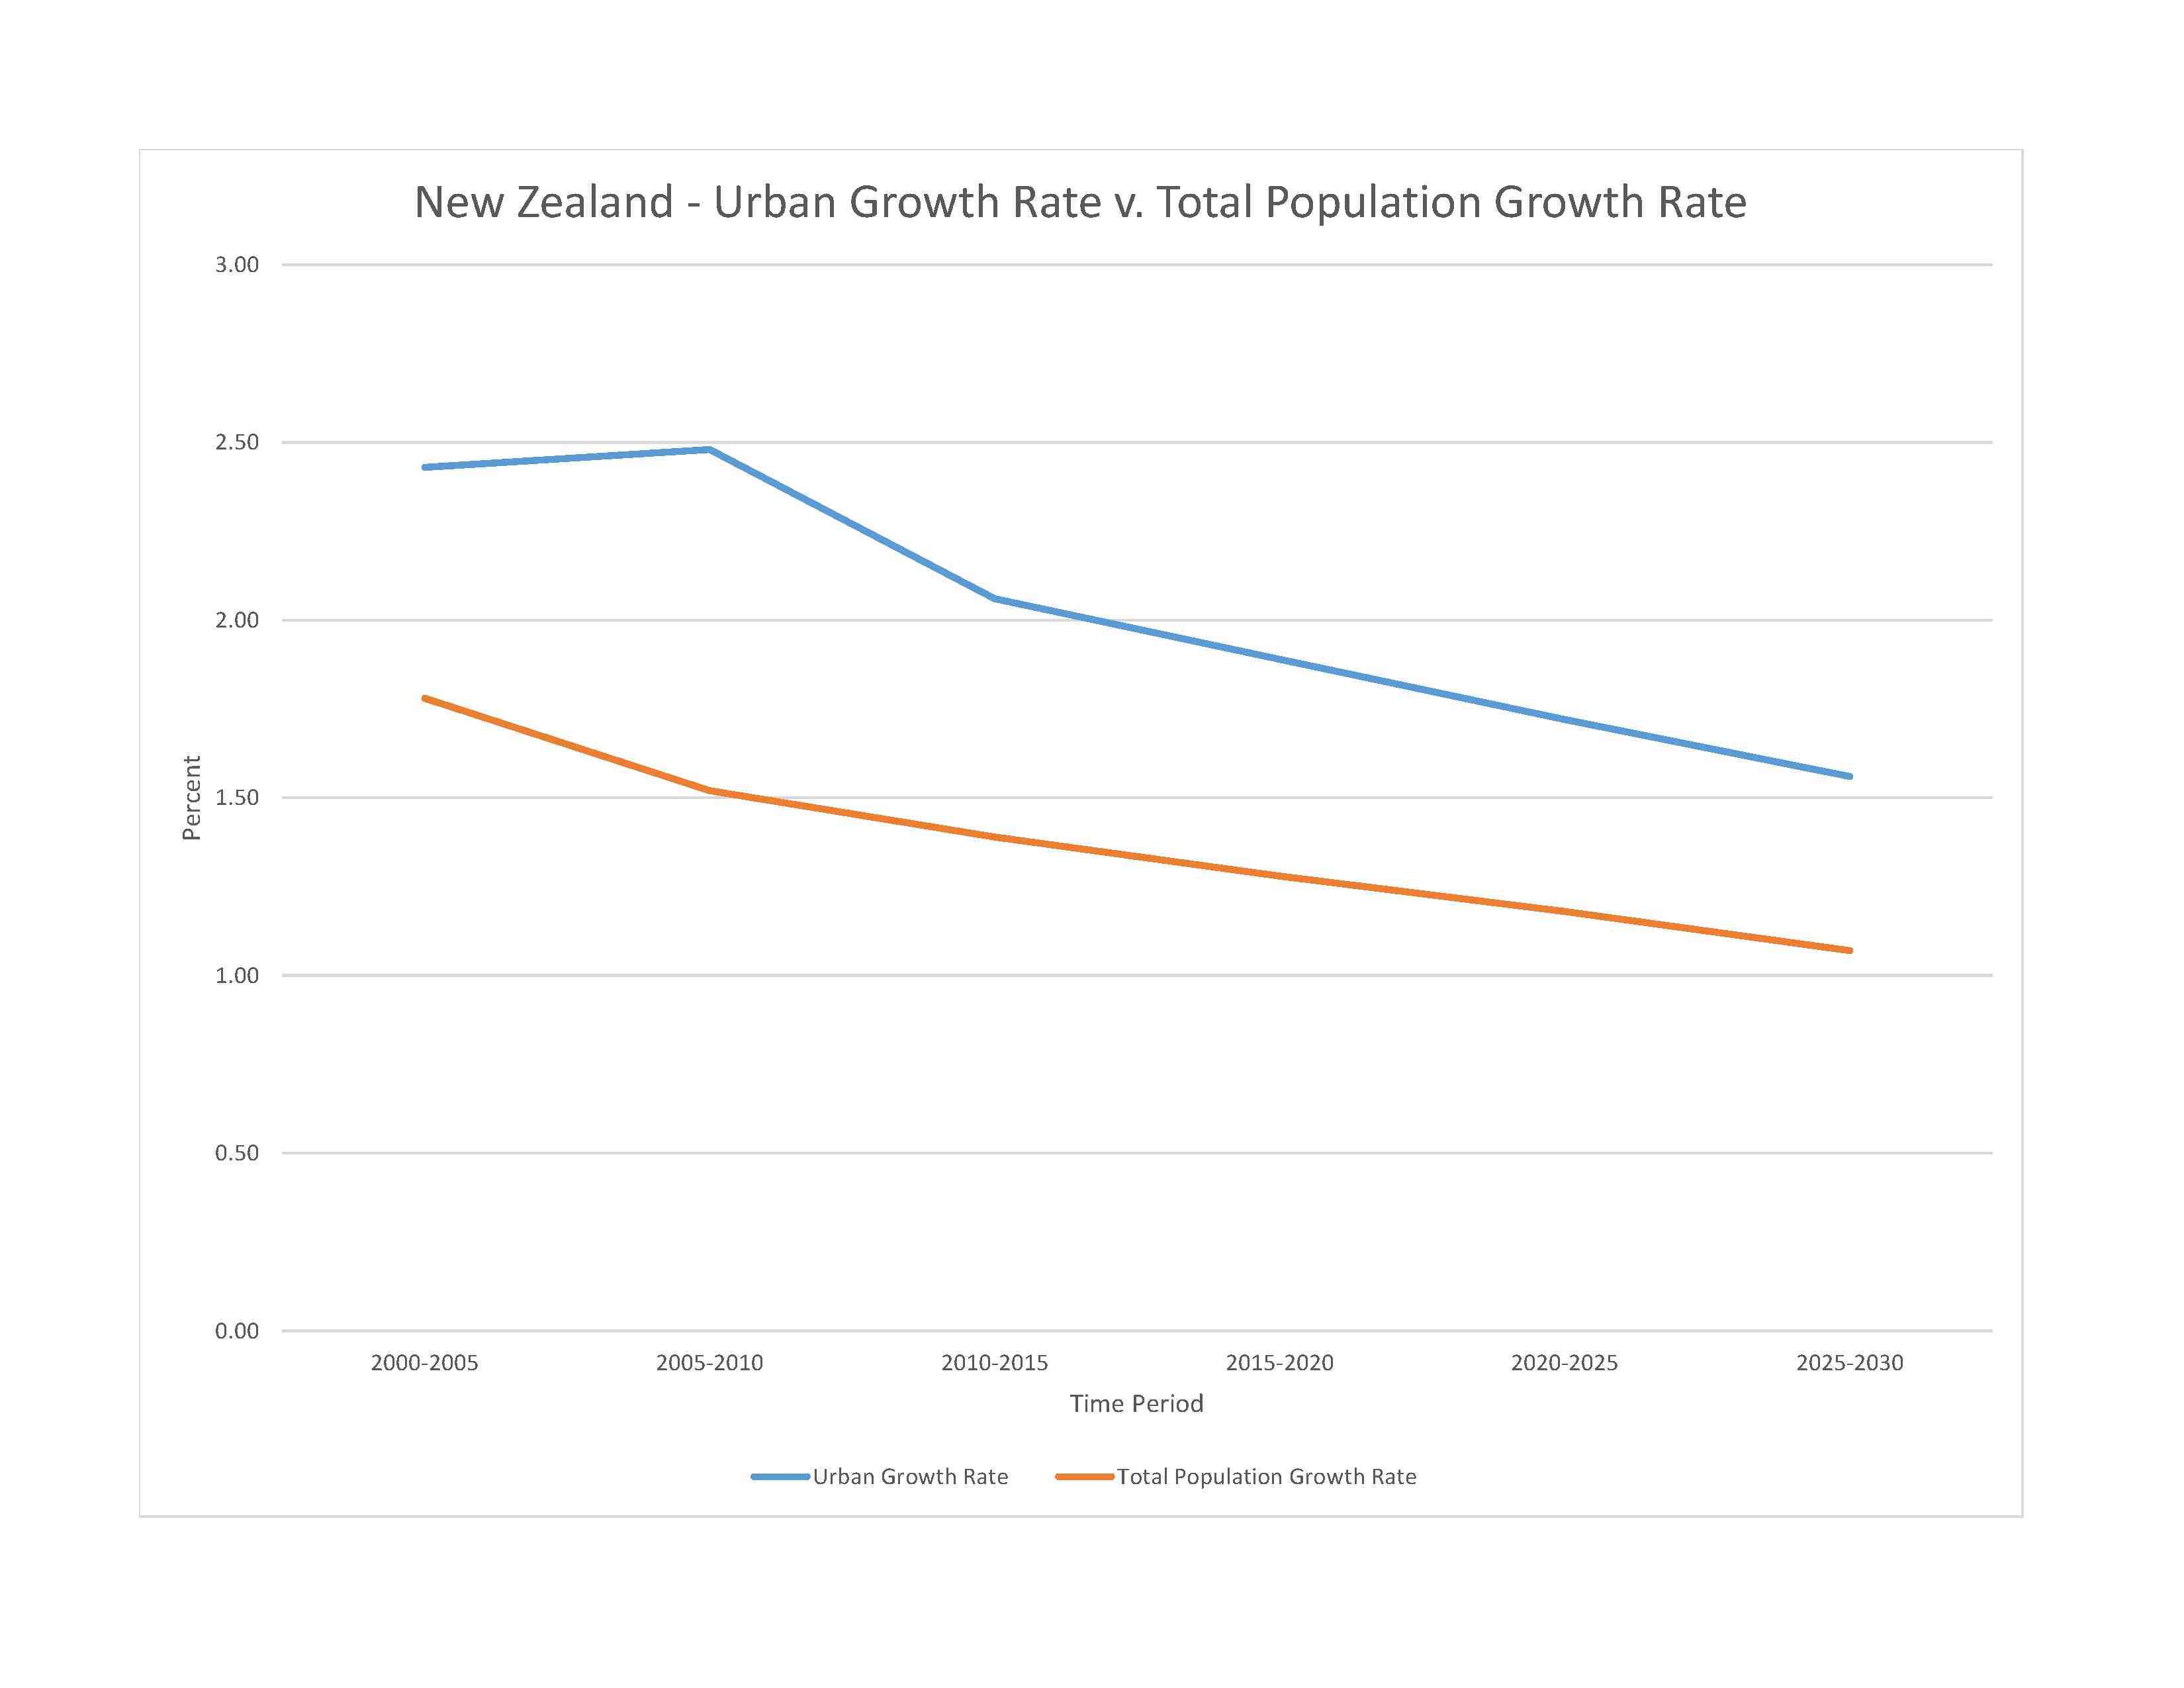
1.06% (2023 est.)
12.7 births/1,000 population (2023 est.)
6.9 deaths/1,000 population (2023 est.)
4.8 migrant(s)/1,000 population (2023 est.)
over three-quarters of New Zealanders, including the indigenous Maori, live on the North Island, primarily in urban areas
urban population: 87% of total population (2023)
rate of urbanization: 0.92% annual rate of change (2020-25 est.)

1.673 million Auckland, 422,000 WELLINGTON (capital) (2023)
at birth: 1.05 male(s)/female
0-14 years: 1.06 male(s)/female
15-64 years: 1.02 male(s)/female
65 years and over: 0.88 male(s)/female
total population: 1 male(s)/female (2023 est.)
27.8 years
7 deaths/100,000 live births (2020 est.)
total: 3.4 deaths/1,000 live births (2023 est.)
male: 3.6 deaths/1,000 live births
female: 3.2 deaths/1,000 live births
total population: 82.7 years (2023 est.)
male: 81 years
female: 84.6 years
1.86 children born/woman (2023 est.)
0.9 (2023 est.)
79.9% (2014/15)
note: percent of women aged 16-49
improved: urban: 100% of population
rural: 100% of population
total: 100% of population
unimproved: urban: 0% of population
rural: 0% of population
total: 0% of population (2020 est.)
10% of GDP (2020)
3.62 physicians/1,000 population (2020)
2.6 beds/1,000 population (2019)
improved: urban: 100% of population
rural: 100% of population
total: 100% of population
unimproved: urban: 0% of population
rural: 0% of population
total: 0% of population (2020)
30.8% (2016)
total: 9.17 liters of pure alcohol (2019 est.)
beer: 3.41 liters of pure alcohol (2019 est.)
wine: 2.88 liters of pure alcohol (2019 est.)
spirits: 1.62 liters of pure alcohol (2019 est.)
other alcohols: 1.26 liters of pure alcohol (2019 est.)
total: 13.7% (2020 est.)
male: 15% (2020 est.)
female: 12.3% (2020 est.)
N/A
57.6% (2023 est.)
6% of GDP (2020 est.)
total population: NA
male: NA
female: NA
total: 20 years
male: 20 years
female: 21 years (2020)
NOTE: The information regarding New Zealand on this page is re-published from the 2024 World Fact Book of the United States Central Intelligence Agency and other sources. No claims are made regarding the accuracy of New Zealand 2024 information contained here. All suggestions for corrections of any errors about New Zealand 2024 should be addressed to the CIA or the source cited on each page.
This page was last modified 04 May 24, Copyright © 2024 ITA all rights reserved.