


Population:
104,124,440
(July 2020 est.)
country comparison to the world (CIA rank, may be based on non-current data):
14
[see also: Population country ranks ]
Nationality:
noun:
Egyptian(s)
adjective:
Egyptian
Ethnic groups:
Egyptian 99.7%, other 0.3%
(2006 est.)
note: data represent respondents by nationality
Languages:
Arabic (official), Arabic, English, and French widely understood by educated classes
Religions:
Muslim (predominantly Sunni) 90%, Christian (majority Coptic Orthodox, other Christians include Armenian Apostolic, Catholic, Maronite, Orthodox, and Anglican) 10%
(2015 est.)
Demographic profile:
Egypt is the most populous country in the Arab world and the third most populous country in Africa, behind Nigeria and Ethiopia. Most of the country is desert, so about 95% of the population is concentrated in a narrow strip of fertile land along the Nile River, which represents only about 5% of Egypt’s land area. Egypt’s rapid population growth – 46% between 1994 and 2014 – stresses limited natural resources, jobs, housing, sanitation, education, and health care.
Although the country’s total fertility rate (TFR) fell from roughly 5.5 children per woman in 1980 to just over 3 in the late 1990s, largely as a result of state-sponsored family planning programs, the population growth rate dropped more modestly because of decreased mortality rates and longer life expectancies. During the last decade, Egypt’s TFR decline stalled for several years and then reversed, reaching 3.6 in 2011, and has plateaued the last few years. Contraceptive use has held steady at about 60%, while preferences for larger families and early marriage may have strengthened in the wake of the recent 2011 revolution. The large cohort of women of or nearing childbearing age will sustain high population growth for the foreseeable future (an effect called population momentum).
Nevertheless, post-MUBARAK governments have not made curbing population growth a priority. To increase contraceptive use and to prevent further overpopulation will require greater government commitment and substantial social change, including encouraging smaller families and better educating and empowering women. Currently, literacy, educational attainment, and labor force participation rates are much lower for women than men. In addition, the prevalence of violence against women, the lack of female political representation, and the perpetuation of the nearly universal practice of female genital cutting continue to keep women from playing a more significant role in Egypt’s public sphere.
Population pressure, poverty, high unemployment, and the fragmentation of inherited land holdings have historically motivated Egyptians, primarily young men, to migrate internally from rural and smaller urban areas in the Nile Delta region and the poorer rural south to Cairo, Alexandria, and other urban centers in the north, while a much smaller number migrated to the Red Sea and Sinai areas. Waves of forced internal migration also resulted from the 1967 Arab-Israeli War and the floods caused by the completion of the Aswan High Dam in 1970. Limited numbers of students and professionals emigrated temporarily prior to the early 1970s, when economic problems and high unemployment pushed the Egyptian Government to lift restrictions on labor migration. At the same time, high oil revenues enabled Saudi Arabia, Iraq, and other Gulf states, as well as Libya and Jordan, to fund development projects, creating a demand for unskilled labor (mainly in construction), which attracted tens of thousands of young Egyptian men.
Between 1970 and 1974 alone, Egyptian migrants in the Gulf countries increased from approximately 70,000 to 370,000. Egyptian officials encouraged legal labor migration both to alleviate unemployment and to generate remittance income (remittances continue to be one of Egypt’s largest sources of foreign currency and GDP). During the mid-1980s, however, depressed oil prices resulting from the Iran-Iraq War, decreased demand for low-skilled labor, competition from less costly South Asian workers, and efforts to replace foreign workers with locals significantly reduced Egyptian migration to the Gulf States. The number of Egyptian migrants dropped from a peak of almost 3.3 million in 1983 to about 2.2 million at the start of the 1990s, but numbers gradually recovered.
In the 2000s, Egypt began facilitating more labor migration through bilateral agreements, notably with Arab countries and Italy, but illegal migration to Europe through overstayed visas or maritime human smuggling via Libya also rose. The Egyptian Government estimated there were 6.5 million Egyptian migrants in 2009, with roughly 75% being temporary migrants in other Arab countries (Libya, Saudi Arabia, Jordan, Kuwait, and the United Arab Emirates) and 25% being predominantly permanent migrants in the West (US, UK, Italy, France, and Canada).
During the 2000s, Egypt became an increasingly important transit and destination country for economic migrants and asylum seekers, including Palestinians, East Africans, and South Asians and, more recently, Iraqis and Syrians. Egypt draws many refugees because of its resettlement programs with the West; Cairo has one of the largest urban refugee populations in the world. Many East African migrants are interned or live in temporary encampments along the Egypt-Israel border, and some have been shot and killed by Egyptian border guards.
Age structure:
0-14 years: 33.62%
(male 18,112,550/female 16,889,155)
[see also: Age structure - 0-14 years country ranks ]
15-24 years: 18.01%
(male 9,684,437/female 9,071,163)
[see also: Age structure - 15-24 years country ranks ]
25-54 years: 37.85%
(male 20,032,310/female 19,376,847)
[see also: Age structure - 25-54 years country ranks ]
55-64 years: 6.08%
(male 3,160,438/female 3,172,544)
[see also: Age structure - 55-64 years country ranks ]
65 years and over: 4.44%
(male 2,213,539/female 2,411,457)
(2020 est.)
[see also: Age structure - 65 years and over country ranks ]
population pyramid:
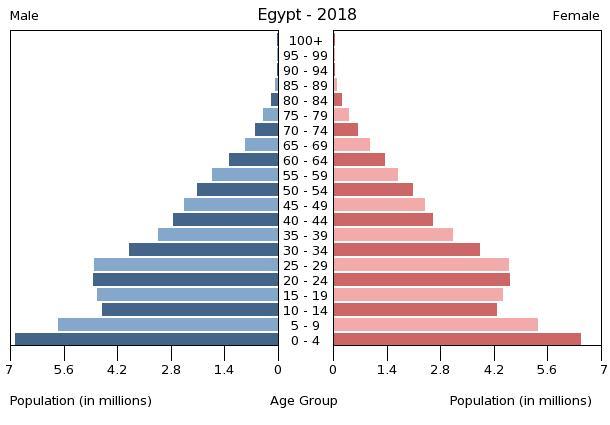
This is the population pyramid for Egypt. A population pyramid illustrates the age and sex structure of a country's population and may provide insights about political and social stability, as well as economic development. The population is distributed along the horizontal axis, with males shown on the left and females on the right. The male and female populations are broken down into 5-year age groups represented as horizontal bars along the vertical axis, with the youngest age groups at the bottom and the oldest at the top. The shape of the population pyramid gradually evolves over time based on fertility, mortality, and international migration trends.
For additional information, please see the entry for Population pyramid on the Definitions and Notes page under the References tab.
Dependency ratios:
total dependency ratio: 61.8
(2015 est.)
[see also: Dependency ratios - total dependency ratio country ranks ]
youth dependency ratio: 53.6
(2015 est.)
[see also: Dependency ratios - youth dependency ratio country ranks ]
elderly dependency ratio: 8.2
(2015 est.)
[see also: Dependency ratios - elderly dependency ratio country ranks ]
potential support ratio: 12.2
(2015 est.)
[see also: Dependency ratios - potential support ratio country ranks ]
Median age:
total: 24.1 years
[see also: Median age - total country ranks ]
male: 23.8 years
[see also: Median age - male country ranks ]
female: 24.5 years
(2020 est.)
[see also: Median age - female country ranks ]
country comparison to the world (CIA rank, may be based on non-current data):
166
Population growth rate:
2.28%
(2020 est.)
country comparison to the world (CIA rank, may be based on non-current data):
31
[see also: Population growth rate country ranks ]
Birth rate:
27.2 births/1,000 population
(2020 est.)
country comparison to the world (CIA rank, may be based on non-current data):
42
[see also: Birth rate country ranks ]
Death rate:
4.4 deaths/1,000 population
(2020 est.)
country comparison to the world (CIA rank, may be based on non-current data):
209
[see also: Death rate country ranks ]
Net migration rate:
-0.3 migrant(s)/1,000 population
(2020 est.)
country comparison to the world (CIA rank, may be based on non-current data):
117
[see also: Net migration rate country ranks ]
Population distribution:
approximately 95% of the population lives within 20 km of the Nile River and its delta; vast areas of the country remain sparsely populated or uninhabited
Urbanization:
urban population: 42.7% of total population
(2019)
[see also: Urbanization - urban population country ranks ]
rate of urbanization: 1.86% annual rate of change
(2015-20 est.)
[see also: Urbanization - rate of urbanization country ranks ]
Major urban areas - population:
20.485 million CAIRO (capital), 5.182 million Alexandria
(2019)
Sex ratio:
at birth: 1.06 male(s)/female
(2020 est.)
[see also: Sex ratio - at birth country ranks ]
0-14 years: 1.07 male(s)/female
(2020 est.)
[see also: Sex ratio - 0-14 years country ranks ]
15-24 years: 1.07 male(s)/female
(2020 est.)
[see also: Sex ratio - 15-24 years country ranks ]
25-54 years: 1.03 male(s)/female
(2020 est.)
[see also: Sex ratio - 25-54 years country ranks ]
55-64 years: 1 male(s)/female
(2020 est.)
[see also: Sex ratio - 55-64 years country ranks ]
65 years and over: 0.92 male(s)/female
(2020 est.)
[see also: Sex ratio - 65 years and over country ranks ]
total population: 104.5 male(s)/female
(2020 est.)
[see also: Sex ratio country ranks ]
Mother's mean age at first birth:
22.7 years
(2014 est.)
note: median age at first birth among women 25-29
[see also: Mother's mean age at first birth country ranks ]
Maternal mortality rate:
37 deaths/100,000 live births
(2017 est.)
country comparison to the world (CIA rank, may be based on non-current data):
102
[see also: Maternal mortality rate country ranks ]
Infant mortality rate:
total: 17.1 deaths/1,000 live births
[see also: Infant mortality rate - total country ranks ]
male: 18.2 deaths/1,000 live births
[see also: Infant mortality rate - male country ranks ]
female: 15.8 deaths/1,000 live births
(2020 est.)
[see also: Infant mortality rate - female country ranks ]
country comparison to the world (CIA rank, may be based on non-current data):
87
Life expectancy at birth:
total population: 73.7 years
[see also: Life expectancy at birth - total population country ranks ]
male: 72.3 years
[see also: Life expectancy at birth - male country ranks ]
female: 75.3 years
(2020 est.)
[see also: Life expectancy at birth - female country ranks ]
country comparison to the world (CIA rank, may be based on non-current data):
140
[See also: Healthy Life Expectancy ]
[See also: Health Performance ]
Total fertility rate:
3.29 children born/woman
(2020 est.)
country comparison to the world (CIA rank, may be based on non-current data):
45
[see also: Total fertility rate country ranks ]
Contraceptive prevalence rate:
58.5%
(2014)
[see also: Contraceptive prevalence rate country ranks ]
Drinking water source:
improved:
urban: 100% of population
[see also: Drinking water source - improved - urban country ranks ]
rural: 99% of population
[see also: Drinking water source - improved - rural country ranks ]
total: 99.4% of population
unimproved:
urban: 0% of population
rural: 1% of population
total: 0.6% of population
(2015 est.)
Current Health Expenditure:
4.6%
(2016)
[see also: Current Health Expenditure country ranks ]
Physicians density:
0.79 physicians/1,000 population
(2017)
[see also: Physicians density country ranks ]
Hospital bed density:
1.6 beds/1,000 population
(2014)
[see also: Hospital bed density country ranks ]
Sanitation facility access:
improved:
urban: 96.8% of population
(2015 est.)
[see also: Sanitation facility access - improved - urban country ranks ]
rural: 93.1% of population
(2015 est.)
[see also: Sanitation facility access - improved - rural country ranks ]
total: 94.7% of population
(2015 est.)
unimproved:
urban: 3.2% of population
(2015 est.)
rural: 6.9% of population
(2015 est.)
total: 5.3% of population
(2015 est.)
HIV/AIDS - adult prevalence rate:
<.1 est.>[see also: HIV/AIDS - adult prevalence rate country ranks ]
HIV/AIDS - people living with HIV/AIDS:
22,000
(2018 est.)
country comparison to the world (CIA rank, may be based on non-current data):
83
[see also: HIV/AIDS - people living with HIV/AIDS country ranks ]
HIV/AIDS - deaths:
[see also: HIV/AIDS - deaths country ranks ]
Major infectious diseases:
degree of risk:
intermediate
(2016)
food or waterborne diseases:
bacterial diarrhea, hepatitis A, and typhoid fever
(2016)
water contact diseases:
schistosomiasis
(2016)
Obesity - adult prevalence rate:
32%
(2016)
country comparison to the world (CIA rank, may be based on non-current data):
18
[see also: Obesity - adult prevalence rate country ranks ]
Children under the age of 5 years underweight:
7%
(2014)
country comparison to the world (CIA rank, may be based on non-current data):
74
[see also: Children under the age of 5 years underweight country ranks ]
Education expenditures:
NA
[see also: Education expenditures country ranks ]
Literacy:
definition:
age 15 and over can read and write
total population: 80.8%
[see also: Literacy - total population country ranks ]
male: 86.5%
[see also: Literacy - male country ranks ]
female: 75%
(2017)
[see also: Literacy - female country ranks ]
School life expectancy (primary to tertiary education):
total: 13 years
[see also: School life expectancy (primary to tertiary education) - total country ranks ]
male: 13 years
[see also: School life expectancy (primary to tertiary education) - male country ranks ]
female: 13 years
[see also: School life expectancy (primary to tertiary education) - male country ranks ]
(2016)
Unemployment, youth ages 15-24
total: 29.6%
[see also: Unemployment, youth ages 15-24 - total country ranks ]
male: 25.7%
[see also: Unemployment, youth ages 15-24 - male country ranks ]
female: 38.3%
(2017 est.)
[see also: Unemployment, youth ages 15-24 - female country ranks ]
country comparison to the world (CIA rank, may be based on non-current data):
33
NOTE: 1) The information regarding Egypt on this page is re-published from the 2020 World Fact Book of the United States Central Intelligence Agency and other sources. No claims are made regarding the accuracy of Egypt People 2020 information contained here. All suggestions for corrections of any errors about Egypt People 2020 should be addressed to the CIA or the source cited on each page.
2) The rank that you see is the CIA reported rank, which may have the following issues:
a) They assign increasing rank number, alphabetically for countries with the same value of the ranked item, whereas we assign them the same rank.
b) The CIA sometimes assigns counterintuitive ranks. For example, it assigns unemployment rates in increasing order, whereas we rank them in decreasing order.
- Main Index
- 2020 Index
- Country Ranks
- Definitions
- Egypt Index 2020
- Egypt Main Index
- Introduction
- History
- Geography
- Climate
- Maps
- People
- Religion
- Government
- Gov. Leaders
- Flags
- Economy
- Energy
- Communications
- Transportation
- Airport Codes
- Military
- Terrorism
- Transnational Issues
- Photos
- Advertise Here
- Feedback

This page was last modified 27-Jan-20