


Location:
Southern Asia, between China and India
Geographic coordinates:
28 00 N, 84 00 E
Map references:
Asia
Area:
total: 147,181 sq km
[see also: Area - total country ranks ]
land: 143,351 sq km
[see also: Area - land country ranks ]
water: 3,830 sq km
[see also: Area - water country ranks ]
country comparison to the world (CIA rank, may be based on non-current data):
96
Area - comparative:
slightly larger than New York state
Area comparison map:
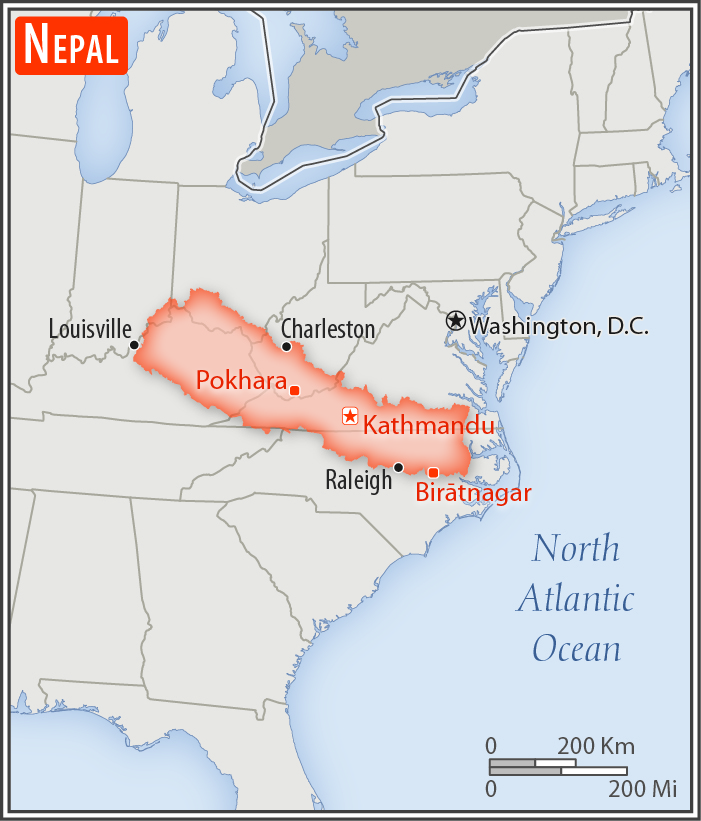
slightly larger than New York state
Land boundaries:
total: 3,159 km
[see also: Land boundaries - total country ranks ]
border countries (2):
China 1389 km, India 1770 km
Coastline:
0 km
(landlocked)
[see also: Coastline country ranks ]
Maritime claims:
none (landlocked)
Climate:
varies from cool summers and severe winters in north to subtropical summers and mild winters in south
More Climate Details
Terrain:
Tarai or flat river plain of the Ganges in south; central hill region with rugged Himalayas in north
Elevation:
mean elevation: 2,565 m
[see also: Elevation - mean elevation country ranks ]
lowest point:
Kanchan Kalan 70 m
highest point:
Mount Everest (highest peak in Asia and highest point on earth above sea level) 8,848 m
Natural resources:
quartz, water, timber, hydropower, scenic beauty, small deposits of lignite, copper, cobalt, iron ore
Land use:
agricultural land: 28.8%
(2011 est.)
[see also: Land use - agricultural land country ranks ]
arable land: 15.1%
(2011 est.)
[see also: Land use - arable land country ranks ]
permanent crops: 1.2%
(2011 est.)
[see also: Land use - permanent crops country ranks ]
permanent pasture: 12.5%
(2011 est.)
[see also: Land use - permanent pasture country ranks ]
forest: 25.4%
(2011 est.)
[see also: Land use - forest country ranks ]
other: 45.8%
(2011 est.)
[see also: Land use country ranks ]
Irrigated land:
13,320 sq km
(2012)
[see also: Irrigated land country ranks ]
Population distribution:
most of the population is divided nearly equally between a concentration in the southern-most plains of the Tarai region and the central hilly region; overall density is quite low
Natural hazards:
severe thunderstorms; flooding; landslides; drought and famine depending on the timing, intensity, and duration of the summer monsoons
Environment - current issues:
deforestation (overuse of wood for fuel and lack of alternatives); forest degradation; soil erosion; contaminated water (with human and animal wastes, agricultural runoff, and industrial effluents); unmanaged solid-waste; wildlife conservation; vehicular emissions
Environment - international agreements:
party to:
Biodiversity, Climate Change, Climate Change-Kyoto Protocol, Desertification, Endangered Species, Hazardous Wastes, Law of the Sea, Ozone Layer Protection, Tropical Timber 83, Tropical Timber 94, Wetlands
signed, but not ratified:
Marine Life Conservation
Geography - note:
landlocked; strategic location between China and India; contains eight of world's 10 highest peaks, including Mount Everest and Kanchenjunga - the world's tallest and third tallest mountains - on the borders with China and India respectively
NOTE: 1) The information regarding Nepal on this page is re-published from the 2020 World Fact Book of the United States Central Intelligence Agency and other sources. No claims are made regarding the accuracy of Nepal Geography 2020 information contained here. All suggestions for corrections of any errors about Nepal Geography 2020 should be addressed to the CIA or the source cited on each page.
2) The rank that you see is the CIA reported rank, which may have the following issues:
a) They assign increasing rank number, alphabetically for countries with the same value of the ranked item, whereas we assign them the same rank.
b) The CIA sometimes assigns counterintuitive ranks. For example, it assigns unemployment rates in increasing order, whereas we rank them in decreasing order.
- Main Index
- 2020 Index
- Country Ranks
- Definitions
- Nepal Index 2020
- Nepal Main Index
- Introduction
- History
- Geography
- Climate
- Maps
- People
- Religion
- Government
- Gov. Leaders
- Flags
- Economy
- Energy
- Communications
- Transportation
- Airport Codes
- Military
- Terrorism
- Transnational Issues
- Photos
- Advertise Here
- Feedback

This page was last modified 27-Jan-20