


Population:
12,712,431
(July 2020 est.)
note: estimates for this country explicitly take into account the effects of excess mortality due to AIDS; this can result in lower life expectancy, higher infant mortality, higher death rates, lower population growth rates, and changes in the distribution of population by age and sex than would otherwise be expected
country comparison to the world (CIA rank, may be based on non-current data):
75
[see also: Population country ranks ]
Nationality:
noun:
Rwandan(s)
adjective:
Rwandan
Ethnic groups:
Hutu, Tutsi, Twa (Pygmy)
Languages:
Kinyarwanda (official, universal Bantu vernacular) 93.2%, French (official) <.1, English (official) <.1, Swahili/Kiswahili (official, used in commercial centers) <.1, more than one language, other 6.3%, unspecified 0.3%
(2002 est.)
Religions:
Protestant 49.5% (includes Adventist 11.8% and other Protestant 37.7%), Roman Catholic 43.7%, Muslim 2%, other 0.9% (includes Jehovah's Witness), none 2.5%, unspecified 1.3%
(2012 est.)
Demographic profile:
Rwanda’s fertility rate declined sharply during the last decade, as a result of the government’s commitment to family planning, the increased use of contraceptives, and a downward trend in ideal family size. Increases in educational attainment, particularly among girls, and exposure to social media also contributed to the reduction in the birth rate. The average number of births per woman decreased from a 5.6 in 2005 to 4.5 in 2016. Despite these significant strides in reducing fertility, Rwanda’s birth rate remains very high and will continue to for an extended period of time because of its large population entering reproductive age. Because Rwanda is one of the most densely populated countries in Africa, its persistent high population growth and increasingly small agricultural landholdings will put additional strain on families’ ability to raise foodstuffs and access potable water. These conditions will also hinder the government’s efforts to reduce poverty and prevent environmental degradation.
The UNHCR recommended that effective 30 June 2013 countries invoke a cessation of refugee status for those Rwandans who fled their homeland between 1959 and 1998, including the 1994 genocide, on the grounds that the conditions that drove them to seek protection abroad no longer exist. The UNHCR’s decision is controversial because many Rwandan refugees still fear persecution if they return home, concerns that are supported by the number of Rwandans granted asylum since 1998 and by the number exempted from the cessation. Rwandan refugees can still seek an exemption or local integration, but host countries are anxious to send the refugees back to Rwanda and are likely to avoid options that enable them to stay. Conversely, Rwanda itself hosts almost 160,000 refugees as of 2017; virtually all of them fleeing conflict in neighboring Burundi and the Democratic Republic of the Congo.
Age structure:
0-14 years: 39.95%
(male 2,564,893/female 2,513,993)
[see also: Age structure - 0-14 years country ranks ]
15-24 years: 20.1%
(male 1,280,948/female 1,273,853)
[see also: Age structure - 15-24 years country ranks ]
25-54 years: 33.06%
(male 2,001,629/female 2,201,132)
[see also: Age structure - 25-54 years country ranks ]
55-64 years: 4.24%
(male 241,462/female 298,163)
[see also: Age structure - 55-64 years country ranks ]
65 years and over: 2.65%
(male 134,648/female 201,710)
(2020 est.)
[see also: Age structure - 65 years and over country ranks ]
population pyramid:
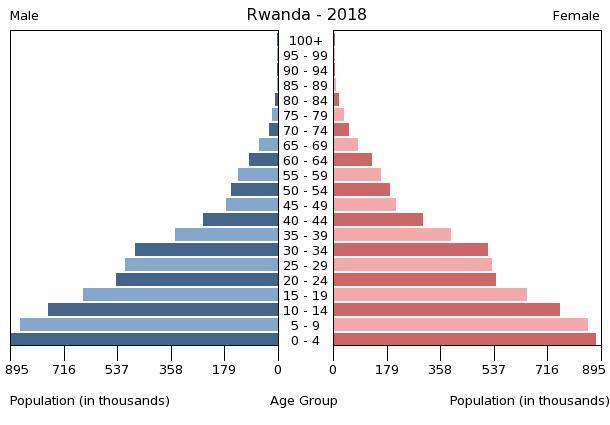
This is the population pyramid for Rwanda. A population pyramid illustrates the age and sex structure of a country's population and may provide insights about political and social stability, as well as economic development. The population is distributed along the horizontal axis, with males shown on the left and females on the right. The male and female populations are broken down into 5-year age groups represented as horizontal bars along the vertical axis, with the youngest age groups at the bottom and the oldest at the top. The shape of the population pyramid gradually evolves over time based on fertility, mortality, and international migration trends.
For additional information, please see the entry for Population pyramid on the Definitions and Notes page under the References tab.
Dependency ratios:
total dependency ratio: 77.3
(2015 est.)
[see also: Dependency ratios - total dependency ratio country ranks ]
youth dependency ratio: 72.4
(2015 est.)
[see also: Dependency ratios - youth dependency ratio country ranks ]
elderly dependency ratio: 5
(2015 est.)
[see also: Dependency ratios - elderly dependency ratio country ranks ]
potential support ratio: 20.1
(2015 est.)
[see also: Dependency ratios - potential support ratio country ranks ]
Median age:
total: 19.7 years
[see also: Median age - total country ranks ]
male: 18.9 years
[see also: Median age - male country ranks ]
female: 20.4 years
(2020 est.)
[see also: Median age - female country ranks ]
country comparison to the world (CIA rank, may be based on non-current data):
200
Population growth rate:
2%
(2020 est.)
country comparison to the world (CIA rank, may be based on non-current data):
47
[see also: Population growth rate country ranks ]
Birth rate:
27.9 births/1,000 population
(2020 est.)
country comparison to the world (CIA rank, may be based on non-current data):
40
[see also: Birth rate country ranks ]
Death rate:
6.1 deaths/1,000 population
(2020 est.)
country comparison to the world (CIA rank, may be based on non-current data):
160
[see also: Death rate country ranks ]
Net migration rate:
-3.3 migrant(s)/1,000 population
(2020 est.)
country comparison to the world (CIA rank, may be based on non-current data):
182
[see also: Net migration rate country ranks ]
Population distribution:
one of Africa's most densely populated countries; large concentrations tend to be in the central regions and along the shore of Lake Kivu in the west
Urbanization:
urban population: 17.3% of total population
(2019)
[see also: Urbanization - urban population country ranks ]
rate of urbanization: 2.86% annual rate of change
(2015-20 est.)
[see also: Urbanization - rate of urbanization country ranks ]
Major urban areas - population:
1.095 million KIGALI (capital)
(2019)
Sex ratio:
at birth: 1.03 male(s)/female
(2020 est.)
[see also: Sex ratio - at birth country ranks ]
0-14 years: 1.02 male(s)/female
(2020 est.)
[see also: Sex ratio - 0-14 years country ranks ]
15-24 years: 1.01 male(s)/female
(2020 est.)
[see also: Sex ratio - 15-24 years country ranks ]
25-54 years: 0.91 male(s)/female
(2020 est.)
[see also: Sex ratio - 25-54 years country ranks ]
55-64 years: 0.81 male(s)/female
(2020 est.)
[see also: Sex ratio - 55-64 years country ranks ]
65 years and over: 0.67 male(s)/female
(2020 est.)
[see also: Sex ratio - 65 years and over country ranks ]
total population: 95.9 male(s)/female
(2020 est.)
[see also: Sex ratio country ranks ]
Mother's mean age at first birth:
23 years
(2014/15 est.)
note: median age at first birth among women 25-29
[see also: Mother's mean age at first birth country ranks ]
Maternal mortality rate:
248 deaths/100,000 live births
(2017 est.)
country comparison to the world (CIA rank, may be based on non-current data):
44
[see also: Maternal mortality rate country ranks ]
Infant mortality rate:
total: 28 deaths/1,000 live births
[see also: Infant mortality rate - total country ranks ]
male: 30.6 deaths/1,000 live births
[see also: Infant mortality rate - male country ranks ]
female: 25.3 deaths/1,000 live births
(2020 est.)
[see also: Infant mortality rate - female country ranks ]
country comparison to the world (CIA rank, may be based on non-current data):
61
Life expectancy at birth:
total population: 65.1 years
[see also: Life expectancy at birth - total population country ranks ]
male: 63.2 years
[see also: Life expectancy at birth - male country ranks ]
female: 67.1 years
(2020 est.)
[see also: Life expectancy at birth - female country ranks ]
country comparison to the world (CIA rank, may be based on non-current data):
196
[See also: Healthy Life Expectancy ]
[See also: Health Performance ]
Total fertility rate:
3.52 children born/woman
(2020 est.)
country comparison to the world (CIA rank, may be based on non-current data):
41
[see also: Total fertility rate country ranks ]
Contraceptive prevalence rate:
53.2%
(2014/15)
[see also: Contraceptive prevalence rate country ranks ]
Drinking water source:
improved:
urban: 86.6% of population
[see also: Drinking water source - improved - urban country ranks ]
rural: 71.9% of population
[see also: Drinking water source - improved - rural country ranks ]
total: 76.1% of population
unimproved:
urban: 13.4% of population
rural: 28.1% of population
total: 23.9% of population
(2015 est.)
Current Health Expenditure:
6.8%
(2016)
[see also: Current Health Expenditure country ranks ]
Physicians density:
0.13 physicians/1,000 population
(2017)
[see also: Physicians density country ranks ]
Sanitation facility access:
improved:
urban: 58.5% of population
(2015 est.)
[see also: Sanitation facility access - improved - urban country ranks ]
rural: 62.9% of population
(2015 est.)
[see also: Sanitation facility access - improved - rural country ranks ]
total: 61.6% of population
(2015 est.)
unimproved:
urban: 41.5% of population
(2015 est.)
rural: 37.1% of population
(2015 est.)
total: 38.4% of population
(2015 est.)
HIV/AIDS - adult prevalence rate:
2.5%
(2018 est.)
country comparison to the world (CIA rank, may be based on non-current data):
20
[see also: HIV/AIDS - adult prevalence rate country ranks ]
HIV/AIDS - people living with HIV/AIDS:
220,000
(2018 est.)
country comparison to the world (CIA rank, may be based on non-current data):
27
[see also: HIV/AIDS - people living with HIV/AIDS country ranks ]
HIV/AIDS - deaths:
2,900
(2018 est.)
country comparison to the world (CIA rank, may be based on non-current data):
36
[see also: HIV/AIDS - deaths country ranks ]
Major infectious diseases:
degree of risk:
very high
(2016)
food or waterborne diseases:
bacterial diarrhea, hepatitis A, and typhoid fever
(2016)
vectorborne diseases:
malaria and dengue fever
(2016)
animal contact diseases:
rabies
(2016)
Obesity - adult prevalence rate:
5.8%
(2016)
country comparison to the world (CIA rank, may be based on non-current data):
174
[see also: Obesity - adult prevalence rate country ranks ]
Children under the age of 5 years underweight:
9.6%
(2015)
country comparison to the world (CIA rank, may be based on non-current data):
65
[see also: Children under the age of 5 years underweight country ranks ]
Education expenditures:
3.1% of GDP
(2018)
country comparison to the world (CIA rank, may be based on non-current data):
137
[see also: Education expenditures country ranks ]
Literacy:
definition:
age 15 and over can read and write
total population: 70.5%
[see also: Literacy - total population country ranks ]
male: 73.2%
[see also: Literacy - male country ranks ]
female: 68%
(2015)
[see also: Literacy - female country ranks ]
School life expectancy (primary to tertiary education):
total: 11 years
[see also: School life expectancy (primary to tertiary education) - total country ranks ]
male: 11 years
[see also: School life expectancy (primary to tertiary education) - male country ranks ]
female: 11 years
[see also: School life expectancy (primary to tertiary education) - male country ranks ]
(2017)
Unemployment, youth ages 15-24
total: 22.6%
[see also: Unemployment, youth ages 15-24 - total country ranks ]
male: 20.6%
[see also: Unemployment, youth ages 15-24 - male country ranks ]
female: 24.8%
(2017 est.)
[see also: Unemployment, youth ages 15-24 - female country ranks ]
country comparison to the world (CIA rank, may be based on non-current data):
59
NOTE: 1) The information regarding Rwanda on this page is re-published from the 2020 World Fact Book of the United States Central Intelligence Agency and other sources. No claims are made regarding the accuracy of Rwanda People 2020 information contained here. All suggestions for corrections of any errors about Rwanda People 2020 should be addressed to the CIA or the source cited on each page.
2) The rank that you see is the CIA reported rank, which may have the following issues:
a) They assign increasing rank number, alphabetically for countries with the same value of the ranked item, whereas we assign them the same rank.
b) The CIA sometimes assigns counterintuitive ranks. For example, it assigns unemployment rates in increasing order, whereas we rank them in decreasing order.
- Main Index
- 2020 Index
- Country Ranks
- Definitions
- Rwanda Index 2020
- Rwanda Main Index
- Introduction
- History
- Geography
- Maps
- People
- Religion
- Government
- Gov. Leaders
- Flags
- Economy
- Energy
- Communications
- Transportation
- Airport Codes
- Military
- Transnational Issues
- Photos
- Advertise Here
- Feedback

This page was last modified 27-Jan-20