


Population:
6,209,660
(July 2020 est.)
country comparison to the world (CIA rank, may be based on non-current data):
110
[see also: Population country ranks ]
Nationality:
noun:
Singaporean(s)
adjective:
Singapore
Ethnic groups:
Chinese 74.3%, Malay 13.4%, Indian 9%, other 3.2%
(2018 est.)
note: individuals self-identify; the population is divided into four categories: Chinese, Malay (includes indigenous Malays and Indonesians), Indian (includes Indian, Pakistani, Bangladeshi, or Sri Lankan), and other ethnic groups (includes Eurasians, Caucasians, Japanese, Filipino, Vietnamese)
Languages:
English (official) 36.9%, Mandarin (official) 34.9%, other Chinese dialects (includes Hokkien, Cantonese, Teochew, Hakka) 12.2%, Malay (official) 10.7%, Tamil (official) 3.3%, other 2%
(2015 est.)
note: data represent language most frequently spoken at home
Religions:
Buddhist 33.2%, Christian 18.8%, Muslim 14%, Taoist 10%, Hindu 5%, other 0.6%, none 18.5%
(2015 est.)
Age structure:
0-14 years: 12.8%
(male 406,983/female 387,665)
[see also: Age structure - 0-14 years country ranks ]
15-24 years: 15.01%
(male 457,190/female 474,676)
[see also: Age structure - 15-24 years country ranks ]
25-54 years: 50.73%
(male 1,531,088/female 1,618,844)
[see also: Age structure - 25-54 years country ranks ]
55-64 years: 10.58%
(male 328,024/female 328,808)
[see also: Age structure - 55-64 years country ranks ]
65 years and over: 10.89%
(male 310,123/female 366,259)
(2020 est.)
[see also: Age structure - 65 years and over country ranks ]
population pyramid:
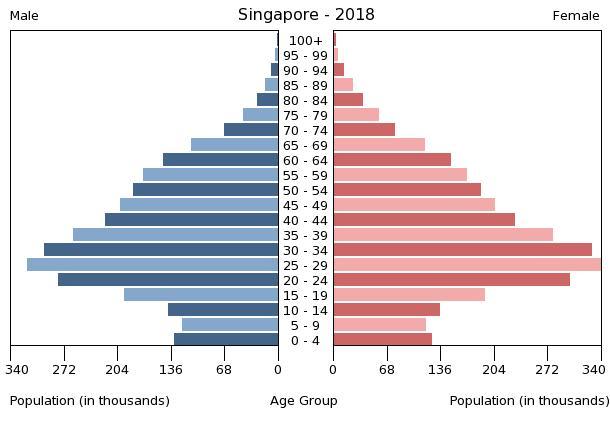
This is the population pyramid for Singapore. A population pyramid illustrates the age and sex structure of a country's population and may provide insights about political and social stability, as well as economic development. The population is distributed along the horizontal axis, with males shown on the left and females on the right. The male and female populations are broken down into 5-year age groups represented as horizontal bars along the vertical axis, with the youngest age groups at the bottom and the oldest at the top. The shape of the population pyramid gradually evolves over time based on fertility, mortality, and international migration trends.
For additional information, please see the entry for Population pyramid on the Definitions and Notes page under the References tab.
Dependency ratios:
total dependency ratio: 37.3
(2015 est.)
[see also: Dependency ratios - total dependency ratio country ranks ]
youth dependency ratio: 21.3
(2015 est.)
[see also: Dependency ratios - youth dependency ratio country ranks ]
elderly dependency ratio: 16
(2015 est.)
[see also: Dependency ratios - elderly dependency ratio country ranks ]
potential support ratio: 6.2
(2015 est.)
[see also: Dependency ratios - potential support ratio country ranks ]
Median age:
total: 35.6 years
[see also: Median age - total country ranks ]
male: 35.4 years
[see also: Median age - male country ranks ]
female: 35.7 years
(2020 est.)
[see also: Median age - female country ranks ]
country comparison to the world (CIA rank, may be based on non-current data):
82
Population growth rate:
1.73%
(2020 est.)
country comparison to the world (CIA rank, may be based on non-current data):
59
[see also: Population growth rate country ranks ]
Birth rate:
8.9 births/1,000 population
(2020 est.)
country comparison to the world (CIA rank, may be based on non-current data):
207
[see also: Birth rate country ranks ]
Death rate:
3.6 deaths/1,000 population
(2020 est.)
country comparison to the world (CIA rank, may be based on non-current data):
218
[see also: Death rate country ranks ]
Net migration rate:
11.8 migrant(s)/1,000 population
(2020 est.)
country comparison to the world (CIA rank, may be based on non-current data):
5
[see also: Net migration rate country ranks ]
Population distribution:
most of the urbanization is along the southern coast, with relatively dense population clusters found in the central areas
Urbanization:
urban population: 100% of total population
(2019)
[see also: Urbanization - urban population country ranks ]
rate of urbanization: 1.39% annual rate of change
(2015-20 est.)
[see also: Urbanization - rate of urbanization country ranks ]
Major urban areas - population:
5.868 million SINGAPORE (capital)
(2019)
Sex ratio:
at birth: 1.07 male(s)/female
(2020 est.)
[see also: Sex ratio - at birth country ranks ]
0-14 years: 1.05 male(s)/female
(2020 est.)
[see also: Sex ratio - 0-14 years country ranks ]
15-24 years: 0.96 male(s)/female
(2020 est.)
[see also: Sex ratio - 15-24 years country ranks ]
25-54 years: 0.95 male(s)/female
(2020 est.)
[see also: Sex ratio - 25-54 years country ranks ]
55-64 years: 1 male(s)/female
(2020 est.)
[see also: Sex ratio - 55-64 years country ranks ]
65 years and over: 0.85 male(s)/female
(2020 est.)
[see also: Sex ratio - 65 years and over country ranks ]
total population: 95.5 male(s)/female
(2020 est.)
[see also: Sex ratio country ranks ]
Mother's mean age at first birth:
30.5 years
(2015 est.)
median age
[see also: Mother's mean age at first birth country ranks ]
Maternal mortality rate:
8 deaths/100,000 live births
(2017 est.)
country comparison to the world (CIA rank, may be based on non-current data):
153
[see also: Maternal mortality rate country ranks ]
Infant mortality rate:
total: 2.3 deaths/1,000 live births
[see also: Infant mortality rate - total country ranks ]
male: 2.4 deaths/1,000 live births
[see also: Infant mortality rate - male country ranks ]
female: 2 deaths/1,000 live births
(2020 est.)
[see also: Infant mortality rate - female country ranks ]
country comparison to the world (CIA rank, may be based on non-current data):
224
Life expectancy at birth:
total population: 86 years
[see also: Life expectancy at birth - total population country ranks ]
male: 83.3 years
[see also: Life expectancy at birth - male country ranks ]
female: 88.9 years
(2020 est.)
[see also: Life expectancy at birth - female country ranks ]
country comparison to the world (CIA rank, may be based on non-current data):
3
[See also: Healthy Life Expectancy ]
[See also: Health Performance ]
Total fertility rate:
0.87 children born/woman
(2020 est.)
country comparison to the world (CIA rank, may be based on non-current data):
228
[see also: Total fertility rate country ranks ]
Drinking water source:
improved:
urban: 100% of population
[see also: Drinking water source - improved - urban country ranks ]
total: 100% of population
unimproved:
urban: 0% of population
total: 0% of population
(2015 est.)
Current Health Expenditure:
4.3%
(2016)
[see also: Current Health Expenditure country ranks ]
Physicians density:
2.31 physicians/1,000 population
(2016)
[see also: Physicians density country ranks ]
Hospital bed density:
2.4 beds/1,000 population
(2015)
[see also: Hospital bed density country ranks ]
Sanitation facility access:
improved:
urban: 100% of population
[see also: Drinking water source - improved - urban country ranks ]
(2015 est.)
total: 100% of population
(2015 est.)
unimproved:
urban: 0% of population
(2015 est.)
total: 0% of population
(2015 est.)
HIV/AIDS - adult prevalence rate:
0.2%
(2018 est.)
country comparison to the world (CIA rank, may be based on non-current data):
111
[see also: HIV/AIDS - adult prevalence rate country ranks ]
HIV/AIDS - people living with HIV/AIDS:
7,900
(2018 est.)
country comparison to the world (CIA rank, may be based on non-current data):
110
[see also: HIV/AIDS - people living with HIV/AIDS country ranks ]
HIV/AIDS - deaths:
<100
(2018 est.)
[see also: HIV/AIDS - deaths country ranks ]
Major infectious diseases:
note: active local transmission of Zika virus by Aedes species mosquitoes has been identified in this country (as of August 2016); it poses an important risk (a large number of cases possible) among US citizens if bitten by an infective mosquito; other less common ways to get Zika are through sex, via blood transfusion, or during pregnancy, in which the pregnant woman passes Zika virus to her fetus
Obesity - adult prevalence rate:
6.1%
(2016)
country comparison to the world (CIA rank, may be based on non-current data):
171
[see also: Obesity - adult prevalence rate country ranks ]
Education expenditures:
2.9% of GDP
(2013)
country comparison to the world (CIA rank, may be based on non-current data):
144
[see also: Education expenditures country ranks ]
Literacy:
definition:
age 15 and over can read and write
total population: 97%
[see also: Literacy - total population country ranks ]
male: 98.7%
[see also: Literacy - male country ranks ]
female: 95.4%
(2016)
[see also: Literacy - female country ranks ]
School life expectancy (primary to tertiary education):
total: 16 years
[see also: School life expectancy (primary to tertiary education) - total country ranks ]
male: 16 years
[see also: School life expectancy (primary to tertiary education) - male country ranks ]
female: 17 years
(2016)
[see also: School life expectancy (primary to tertiary education) - female country ranks ]
Unemployment, youth ages 15-24
total: 9.1%
[see also: Unemployment, youth ages 15-24 - total country ranks ]
male: 6.2%
[see also: Unemployment, youth ages 15-24 - male country ranks ]
female: 12.5%
(2016 est.)
[see also: Unemployment, youth ages 15-24 - female country ranks ]
country comparison to the world (CIA rank, may be based on non-current data):
134
NOTE: 1) The information regarding Singapore on this page is re-published from the 2020 World Fact Book of the United States Central Intelligence Agency and other sources. No claims are made regarding the accuracy of Singapore People 2020 information contained here. All suggestions for corrections of any errors about Singapore People 2020 should be addressed to the CIA or the source cited on each page.
2) The rank that you see is the CIA reported rank, which may have the following issues:
a) They assign increasing rank number, alphabetically for countries with the same value of the ranked item, whereas we assign them the same rank.
b) The CIA sometimes assigns counterintuitive ranks. For example, it assigns unemployment rates in increasing order, whereas we rank them in decreasing order.
- Main Index
- 2020 Index
- Country Ranks
- Definitions
- Singapore Index 2020
- Singapore Main Index
- Introduction
- History
- Geography
- Climate
- Maps
- People
- Religion
- Government
- Gov. Leaders
- Flags
- Economy
- Energy
- Communications
- Transportation
- Airport Codes
- Military
- Terrorism
- Transnational Issues
- Photos
- Advertise Here
- Feedback

This page was last modified 27-Jan-20