


Population:
16,877,357
(July 2020 est.)
country comparison to the world (CIA rank, may be based on non-current data):
71
[see also: Population country ranks ]
Nationality:
noun:
Chadian(s)
adjective:
Chadian
Ethnic groups:
Sara (Ngambaye/Sara/Madjingaye/Mbaye) 30.5%, Kanembu/Bornu/Buduma 9.8%, Arab 9.7%, Wadai/Maba/Masalit/Mimi 7%, Gorane 5.8%, Masa/Musseye/Musgum 4.9%, Bulala/Medogo/Kuka 3.7%, Marba/Lele/Mesme 3.5%, Mundang 2.7%, Bidiyo/Migaama/Kenga/Dangleat 2.5%, Dadjo/Kibet/Muro 2.4%, Tupuri/Kera 2%, Gabri/Kabalaye/Nanchere/Somrai 2%, Fulani/Fulbe/Bodore 1.8%, Karo/Zime/Peve 1.3%, Baguirmi/Barma 1.2%, Zaghawa/Bideyat/Kobe 1.1%, Tama/Assongori/Mararit 1.1%, Mesmedje/Massalat/Kadjakse 0.8%, other Chadian ethnicities 3.4%, Chadians of foreign ethnicities 0.9%, foreign nationals 0.3%, unspecified 1.7%
(2014-15 est.)
Languages:
French (official), Arabic (official), Sara (in south), more than 120 different languages and dialects
Religions:
Muslim 52.1%, Protestant 23.9%, Roman Catholic 20%, animist 0.3%, other Christian 0.2%, none 2.8%, unspecified 0.7%
(2014-15 est.)
Demographic profile:
Despite the start of oil production in 2003, 40% of Chad’s population lives below the poverty line. The population will continue to grow rapidly because of the country’s very high fertility rate and large youth cohort – more than 65% of the populace is under the age of 25 – although the mortality rate is high and life expectancy is low. Chad has the world’s third highest maternal mortality rate. Among the primary risk factors are poverty, anemia, rural habitation, high fertility, poor education, and a lack of access to family planning and obstetric care. Impoverished, uneducated adolescents living in rural areas are most affected. To improve women’s reproductive health and reduce fertility, Chad will need to increase women’s educational attainment, job participation, and knowledge of and access to family planning. Only about a quarter of women are literate, less than 5% use contraceptives, and more than 40% undergo genital cutting.
As of October 2017, more than 320,000 refugees from Sudan and more than 75,000 from the Central African Republic strain Chad’s limited resources and create tensions in host communities. Thousands of new refugees fled to Chad in 2013 to escape worsening violence in the Darfur region of Sudan. The large refugee populations are hesitant to return to their home countries because of continued instability. Chad was relatively stable in 2012 in comparison to other states in the region, but past fighting between government forces and opposition groups and inter-communal violence have left nearly 60,000 of its citizens displaced in the eastern part of the country.
Age structure:
0-14 years: 47.43%
(male 4,050,505/female 3,954,413)
[see also: Age structure - 0-14 years country ranks ]
15-24 years: 19.77%
(male 1,676,495/female 1,660,417)
[see also: Age structure - 15-24 years country ranks ]
25-54 years: 27.14%
(male 2,208,181/female 2,371,490)
[see also: Age structure - 25-54 years country ranks ]
55-64 years: 3.24%
(male 239,634/female 306,477)
[see also: Age structure - 55-64 years country ranks ]
65 years and over: 2.43%
(male 176,658/female 233,087)
(2020 est.)
[see also: Age structure - 65 years and over country ranks ]
population pyramid:
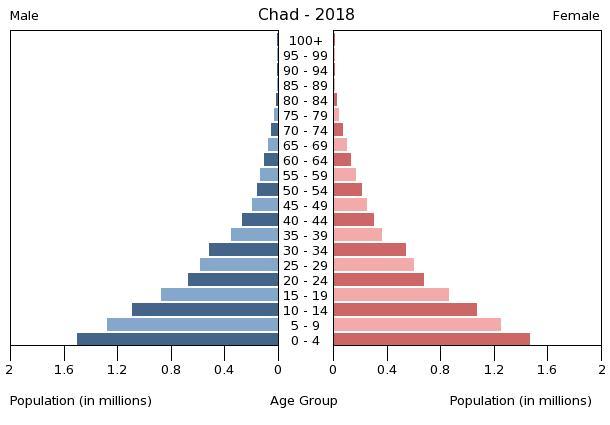
This is the population pyramid for Chad. A population pyramid illustrates the age and sex structure of a country's population and may provide insights about political and social stability, as well as economic development. The population is distributed along the horizontal axis, with males shown on the left and females on the right. The male and female populations are broken down into 5-year age groups represented as horizontal bars along the vertical axis, with the youngest age groups at the bottom and the oldest at the top. The shape of the population pyramid gradually evolves over time based on fertility, mortality, and international migration trends.
For additional information, please see the entry for Population pyramid on the Definitions and Notes page under the References tab.
Dependency ratios:
total dependency ratio: 100.2
(2015 est.)
[see also: Dependency ratios - total dependency ratio country ranks ]
youth dependency ratio: 95.2
(2015 est.)
[see also: Dependency ratios - youth dependency ratio country ranks ]
elderly dependency ratio: 4.9
(2015 est.)
[see also: Dependency ratios - elderly dependency ratio country ranks ]
potential support ratio: 20.3
(2015 est.)
[see also: Dependency ratios - potential support ratio country ranks ]
Median age:
total: 16.1 years
[see also: Median age - total country ranks ]
male: 15.6 years
[see also: Median age - male country ranks ]
female: 16.5 years
(2020 est.)
[see also: Median age - female country ranks ]
country comparison to the world (CIA rank, may be based on non-current data):
224
Population growth rate:
3.18%
(2020 est.)
country comparison to the world (CIA rank, may be based on non-current data):
7
[see also: Population growth rate country ranks ]
Birth rate:
41.7 births/1,000 population
(2020 est.)
country comparison to the world (CIA rank, may be based on non-current data):
6
[see also: Birth rate country ranks ]
Death rate:
10 deaths/1,000 population
(2020 est.)
country comparison to the world (CIA rank, may be based on non-current data):
38
[see also: Death rate country ranks ]
Net migration rate:
-0.1 migrant(s)/1,000 population
(2020 est.)
country comparison to the world (CIA rank, may be based on non-current data):
102
[see also: Net migration rate country ranks ]
Population distribution:
the population is unevenly distributed due to contrasts in climate and physical geography; the highest density is found in the southwest, particularly around Lake Chad and points south; the dry Saharan zone to the north is the least densely populated
Urbanization:
urban population: 23.3% of total population
(2019)
[see also: Urbanization - urban population country ranks ]
rate of urbanization: 3.88% annual rate of change
(2015-20 est.)
[see also: Urbanization - rate of urbanization country ranks ]
Major urban areas - population:
1.372 million N'DJAMENA (capital)
(2019)
Sex ratio:
at birth: 1.04 male(s)/female
(2020 est.)
[see also: Sex ratio - at birth country ranks ]
0-14 years: 1.02 male(s)/female
(2020 est.)
[see also: Sex ratio - 0-14 years country ranks ]
15-24 years: 1.01 male(s)/female
(2020 est.)
[see also: Sex ratio - 15-24 years country ranks ]
25-54 years: 0.93 male(s)/female
(2020 est.)
[see also: Sex ratio - 25-54 years country ranks ]
55-64 years: 0.78 male(s)/female
(2020 est.)
[see also: Sex ratio - 55-64 years country ranks ]
65 years and over: 0.76 male(s)/female
(2020 est.)
[see also: Sex ratio - 65 years and over country ranks ]
total population: 98 male(s)/female
(2020 est.)
[see also: Sex ratio country ranks ]
Mother's mean age at first birth:
17.9 years
(2014/15 est.)
note: median age at first birth among women 25-29
[see also: Mother's mean age at first birth country ranks ]
Maternal mortality rate:
1,140 deaths/100,000 live births
(2017 est.)
country comparison to the world (CIA rank, may be based on non-current data):
2
[see also: Maternal mortality rate country ranks ]
Infant mortality rate:
total: 68.6 deaths/1,000 live births
[see also: Infant mortality rate - total country ranks ]
male: 74.5 deaths/1,000 live births
[see also: Infant mortality rate - male country ranks ]
female: 62.5 deaths/1,000 live births
(2020 est.)
[see also: Infant mortality rate - female country ranks ]
country comparison to the world (CIA rank, may be based on non-current data):
5
Life expectancy at birth:
total population: 58.3 years
[see also: Life expectancy at birth - total population country ranks ]
male: 56.5 years
[see also: Life expectancy at birth - male country ranks ]
female: 60.1 years
(2020 est.)
[see also: Life expectancy at birth - female country ranks ]
country comparison to the world (CIA rank, may be based on non-current data):
221
[See also: Healthy Life Expectancy ]
[See also: Health Performance ]
Total fertility rate:
5.68 children born/woman
(2020 est.)
country comparison to the world (CIA rank, may be based on non-current data):
5
[see also: Total fertility rate country ranks ]
Contraceptive prevalence rate:
5.7%
(2014/15)
[see also: Contraceptive prevalence rate country ranks ]
Drinking water source:
improved:
urban: 71.8% of population
[see also: Drinking water source - improved - urban country ranks ]
rural: 44.8% of population
[see also: Drinking water source - improved - rural country ranks ]
total: 50.8% of population
unimproved:
urban: 28.2% of population
rural: 55.2% of population
total: 49.2% of population
(2015 est.)
Current Health Expenditure:
4.5%
(2016)
[see also: Current Health Expenditure country ranks ]
Physicians density:
0.05 physicians/1,000 population
(2016)
[see also: Physicians density country ranks ]
Hospital bed density:
Sanitation facility access:
improved:
urban: 31.4% of population
(2015 est.)
rural: 6.5% of population
(2015 est.)
total: 12.1% of population
(2015 est.)
unimproved:
urban: 68.6% of population
(2015 est.)
rural: 93.5% of population
(2015 est.)
total: 87.9% of population
(2015 est.)
[see also: Hospital bed density country ranks ]
HIV/AIDS - adult prevalence rate:
1.3%
(2018 est.)
country comparison to the world (CIA rank, may be based on non-current data):
38
[see also: HIV/AIDS - adult prevalence rate country ranks ]
HIV/AIDS - people living with HIV/AIDS:
120,000
(2018 est.)
country comparison to the world (CIA rank, may be based on non-current data):
39
[see also: HIV/AIDS - people living with HIV/AIDS country ranks ]
HIV/AIDS - deaths:
3,100
(2018 est.)
country comparison to the world (CIA rank, may be based on non-current data):
35
[see also: HIV/AIDS - deaths country ranks ]
Major infectious diseases:
degree of risk:
very high
(2016)
food or waterborne diseases:
bacterial and protozoal diarrhea, hepatitis A and E, and typhoid fever
(2016)
vectorborne diseases:
malaria and dengue fever
(2016)
water contact diseases:
schistosomiasis
(2016)
animal contact diseases:
rabies
(2016)
respiratory diseases:
meningococcal meningitis
(2016)
Obesity - adult prevalence rate:
6.1%
(2016)
country comparison to the world (CIA rank, may be based on non-current data):
170
[see also: Obesity - adult prevalence rate country ranks ]
Children under the age of 5 years underweight:
29.4%
(2015)
country comparison to the world (CIA rank, may be based on non-current data):
11
[see also: Children under the age of 5 years underweight country ranks ]
Education expenditures:
2.9% of GDP
(2013)
country comparison to the world (CIA rank, may be based on non-current data):
140
[see also: Education expenditures country ranks ]
Literacy:
definition:
age 15 and over can read and write French or Arabic
total population: 22.3%
[see also: Literacy - total population country ranks ]
male: 31.3%
[see also: Literacy - male country ranks ]
female: 14%
(2016)
[see also: Literacy - female country ranks ]
School life expectancy (primary to tertiary education):
total: 8 years
[see also: School life expectancy (primary to tertiary education) - total country ranks ]
male: 9 years
[see also: School life expectancy (primary to tertiary education) - male country ranks ]
female: 6 years
(2014)
[see also: School life expectancy (primary to tertiary education) - female country ranks ]
NOTE: 1) The information regarding Chad on this page is re-published from the 2020 World Fact Book of the United States Central Intelligence Agency and other sources. No claims are made regarding the accuracy of Chad People 2020 information contained here. All suggestions for corrections of any errors about Chad People 2020 should be addressed to the CIA or the source cited on each page.
2) The rank that you see is the CIA reported rank, which may have the following issues:
a) They assign increasing rank number, alphabetically for countries with the same value of the ranked item, whereas we assign them the same rank.
b) The CIA sometimes assigns counterintuitive ranks. For example, it assigns unemployment rates in increasing order, whereas we rank them in decreasing order.
- Main Index
- 2020 Index
- Country Ranks
- Definitions
- Chad Index 2020
- Chad Main Index
- Introduction
- History
- Geography
- Climate
- Maps
- People
- Religion
- Government
- Gov. Leaders
- Flags
- Economy
- Energy
- Communications
- Transportation
- Airport Codes
- Military
- Terrorism
- Transnational Issues
- Photos
- Advertise Here
- Feedback

This page was last modified 27-Jan-20