


Population:
16,904,867
(July 2020 est.)
country comparison to the world (CIA rank, may be based on non-current data):
70
[see also: Population country ranks ]
Nationality:
noun:
Ecuadorian(s)
adjective:
Ecuadorian
Ethnic groups:
mestizo (mixed Amerindian and white) 71.9%, Montubio 7.4%, Amerindian 7%, white 6.1%, Afroecuadorian 4.3%, mulatto 1.9%, black 1%, other 0.4%
(2010 est.)
Languages:
Spanish (Castilian) 93% (official), Quechua 4.1%, other indigenous 0.7%, foreign 2.2%
(2010 est.)
note: (Quechua and Shuar are official languages of intercultural relations; other indigenous languages are in official use by indigenous peoples in the areas they inhabit)
Religions:
Roman Catholic 74%, Evangelical 10.4%, Jehovah's Witness 1.2%, other 6.4% (includes Mormon, Buddhist, Jewish, Spiritualist, Muslim, Hindu, indigenous, African American, Pentecostal), atheist 7.9%, agnostic 0.1%
(2012 est.)
note: data represent persons at least 16 years of age from five Ecuadoran cities
Demographic profile:
Ecuador's high poverty and income inequality most affect indigenous, mixed race, and rural populations. The government has increased its social spending to ameliorate these problems, but critics question the efficiency and implementation of its national development plan. Nevertheless, the conditional cash transfer program, which requires participants' children to attend school and have medical check-ups, has helped improve educational attainment and healthcare among poor children. Ecuador is stalled at above replacement level fertility and the population most likely will keep growing rather than stabilize.
An estimated 2 to 3 million Ecuadorians live abroad, but increased unemployment in key receiving countries - Spain, the United States, and Italy - is slowing emigration and increasing the likelihood of returnees to Ecuador. The first large-scale emigration of Ecuadorians occurred between 1980 and 2000, when an economic crisis drove Ecuadorians from southern provinces to New York City, where they had trade contacts. A second, nationwide wave of emigration in the late 1990s was caused by another economic downturn, political instability, and a currency crisis. Spain was the logical destination because of its shared language and the wide availability of low-skilled, informal jobs at a time when increased border surveillance made illegal migration to the US difficult. Ecuador has a small but growing immigrant population and is Latin America's top recipient of refugees; 98% are neighboring Colombians fleeing violence in their country.
Age structure:
0-14 years: 25.82%
(male 2,226,240/female 2,138,219)
[see also: Age structure - 0-14 years country ranks ]
15-24 years: 17.8%
(male 1,531,545/female 1,478,222)
[see also: Age structure - 15-24 years country ranks ]
25-54 years: 40.31%
(male 3,333,650/female 3,480,262)
[see also: Age structure - 25-54 years country ranks ]
55-64 years: 7.92%
(male 647,718/female 691,759)
[see also: Age structure - 55-64 years country ranks ]
65 years and over: 8.15%
(male 648,761/female 728,491)
(2020 est.)
[see also: Age structure - 65 years and over country ranks ]
population pyramid:
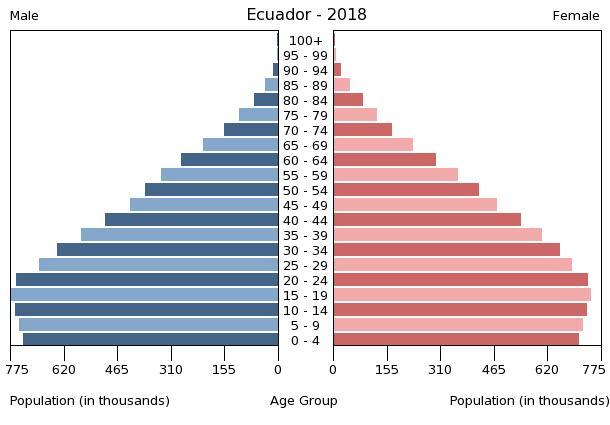
This is the population pyramid for Ecuador. A population pyramid illustrates the age and sex structure of a country's population and may provide insights about political and social stability, as well as economic development. The population is distributed along the horizontal axis, with males shown on the left and females on the right. The male and female populations are broken down into 5-year age groups represented as horizontal bars along the vertical axis, with the youngest age groups at the bottom and the oldest at the top. The shape of the population pyramid gradually evolves over time based on fertility, mortality, and international migration trends.
For additional information, please see the entry for Population pyramid on the Definitions and Notes page under the References tab.
Dependency ratios:
total dependency ratio: 55.6
(2015 est.)
[see also: Dependency ratios - total dependency ratio country ranks ]
youth dependency ratio: 45.1
(2015 est.)
[see also: Dependency ratios - youth dependency ratio country ranks ]
elderly dependency ratio: 10.4
(2015 est.)
[see also: Dependency ratios - elderly dependency ratio country ranks ]
potential support ratio: 9.6
(2015 est.)
[see also: Dependency ratios - potential support ratio country ranks ]
Median age:
total: 28.8 years
[see also: Median age - total country ranks ]
male: 28 years
[see also: Median age - male country ranks ]
female: 29.6 years
(2020 est.)
[see also: Median age - female country ranks ]
country comparison to the world (CIA rank, may be based on non-current data):
140
Population growth rate:
1.2%
(2020 est.)
country comparison to the world (CIA rank, may be based on non-current data):
89
[see also: Population growth rate country ranks ]
Birth rate:
17 births/1,000 population
(2020 est.)
country comparison to the world (CIA rank, may be based on non-current data):
100
[see also: Birth rate country ranks ]
Death rate:
5.2 deaths/1,000 population
(2020 est.)
country comparison to the world (CIA rank, may be based on non-current data):
194
[see also: Death rate country ranks ]
Net migration rate:
0 migrant(s)/1,000 population
(2020 est.)
country comparison to the world (CIA rank, may be based on non-current data):
80
[see also: Net migration rate country ranks ]
Population distribution:
nearly half of the population is concentrated in the interior in the Andean intermontane basins and valleys, with large concentrations also found along the western coastal strip; the rainforests of the east remain sparsely populated
Urbanization:
urban population: 64% of total population
(2019)
[see also: Urbanization - urban population country ranks ]
rate of urbanization: 1.66% annual rate of change
(2015-20 est.)
[see also: Urbanization - rate of urbanization country ranks ]
Major urban areas - population:
2.946 million Guayaquil, 1.848 million QUITO (capital)
(2019)
Sex ratio:
at birth: 1.05 male(s)/female
(2020 est.)
[see also: Sex ratio - at birth country ranks ]
0-14 years: 1.04 male(s)/female
(2020 est.)
[see also: Sex ratio - 0-14 years country ranks ]
15-24 years: 1.04 male(s)/female
(2020 est.)
[see also: Sex ratio - 15-24 years country ranks ]
25-54 years: 0.96 male(s)/female
(2020 est.)
[see also: Sex ratio - 25-54 years country ranks ]
55-64 years: 0.94 male(s)/female
(2020 est.)
[see also: Sex ratio - 55-64 years country ranks ]
65 years and over: 0.89 male(s)/female
(2020 est.)
[see also: Sex ratio - 65 years and over country ranks ]
total population: 98.5 male(s)/female
(2020 est.)
[see also: Sex ratio country ranks ]
Maternal mortality rate:
59 deaths/100,000 live births
(2017 est.)
country comparison to the world (CIA rank, may be based on non-current data):
90
[see also: Maternal mortality rate country ranks ]
Infant mortality rate:
total: 15 deaths/1,000 live births
[see also: Infant mortality rate - total country ranks ]
male: 17.8 deaths/1,000 live births
[see also: Infant mortality rate - male country ranks ]
female: 12 deaths/1,000 live births
(2020 est.)
[see also: Infant mortality rate - female country ranks ]
country comparison to the world (CIA rank, may be based on non-current data):
97
Life expectancy at birth:
total population: 77.5 years
[see also: Life expectancy at birth - total population country ranks ]
male: 74.5 years
[see also: Life expectancy at birth - male country ranks ]
female: 80.6 years
(2020 est.)
[see also: Life expectancy at birth - female country ranks ]
country comparison to the world (CIA rank, may be based on non-current data):
80
[See also: Healthy Life Expectancy ]
[See also: Health Performance ]
Total fertility rate:
2.09 children born/woman
(2020 est.)
country comparison to the world (CIA rank, may be based on non-current data):
99
[see also: Total fertility rate country ranks ]
Contraceptive prevalence rate:
80.1%
(2007/12)
[see also: Contraceptive prevalence rate country ranks ]
Drinking water source:
improved:
urban: 93.4% of population
[see also: Drinking water source - improved - urban country ranks ]
rural: 75.5% of population
[see also: Drinking water source - improved - rural country ranks ]
total: 86.9% of population
unimproved:
urban: 6.6% of population
rural: 24.5% of population
total: 13.1% of population
(2015 est.)
Current Health Expenditure:
8.4%
(2016)
[see also: Current Health Expenditure country ranks ]
Physicians density:
2.05 physicians/1,000 population
(2016)
[see also: Physicians density country ranks ]
Hospital bed density:
1.5 beds/1,000 population
(2013)
[see also: Hospital bed density country ranks ]
Sanitation facility access:
improved:
urban: 87% of population
(2015 est.)
[see also: Sanitation facility access - improved - urban country ranks ]
rural: 80.7% of population
(2015 est.)
[see also: Sanitation facility access - improved - rural country ranks ]
total: 84.7% of population
(2015 est.)
unimproved:
urban: 13% of population
(2015 est.)
rural: 19.3% of population
(2015 est.)
total: 15.3% of population
(2015 est.)
HIV/AIDS - adult prevalence rate:
0.4%
(2018 est.)
country comparison to the world (CIA rank, may be based on non-current data):
78
[see also: HIV/AIDS - adult prevalence rate country ranks ]
HIV/AIDS - people living with HIV/AIDS:
44,000
(2018 est.)
country comparison to the world (CIA rank, may be based on non-current data):
63
[see also: HIV/AIDS - people living with HIV/AIDS country ranks ]
HIV/AIDS - deaths:
<1000
(2018 est.)
[see also: HIV/AIDS - deaths country ranks ]
Major infectious diseases:
degree of risk:
high
(2016)
food or waterborne diseases:
bacterial diarrhea, hepatitis A, and typhoid fever
(2016)
vectorborne diseases:
dengue fever and malaria
(2016)
note: active local transmission of Zika virus by Aedes species mosquitoes has been identified in this country (as of August 2016); it poses an important risk (a large number of cases possible) among US citizens if bitten by an infective mosquito; other less common ways to get Zika are through sex, via blood transfusion, or during pregnancy, in which the pregnant woman passes Zika virus to her fetus
Obesity - adult prevalence rate:
19.9%
(2016)
country comparison to the world (CIA rank, may be based on non-current data):
107
[see also: Obesity - adult prevalence rate country ranks ]
Children under the age of 5 years underweight:
5.1%
(2014)
country comparison to the world (CIA rank, may be based on non-current data):
81
[see also: Children under the age of 5 years underweight country ranks ]
Education expenditures:
5% of GDP
(2015)
country comparison to the world (CIA rank, may be based on non-current data):
62
[see also: Education expenditures country ranks ]
Literacy:
definition:
age 15 and over can read and write
total population: 94.4%
[see also: Literacy - total population country ranks ]
male: 95.4%
[see also: Literacy - male country ranks ]
female: 93.3%
(2016)
[see also: Literacy - female country ranks ]
School life expectancy (primary to tertiary education):
total: 16 years
[see also: School life expectancy (primary to tertiary education) - total country ranks ]
male: 15 years
[see also: School life expectancy (primary to tertiary education) - male country ranks ]
female: 16 years
(2015)
[see also: School life expectancy (primary to tertiary education) - female country ranks ]
Unemployment, youth ages 15-24
total: 7.9%
[see also: Unemployment, youth ages 15-24 - total country ranks ]
male: 6.4%
[see also: Unemployment, youth ages 15-24 - male country ranks ]
female: 10.6%
(2018 est.)
[see also: Unemployment, youth ages 15-24 - female country ranks ]
country comparison to the world (CIA rank, may be based on non-current data):
145
NOTE: 1) The information regarding Ecuador on this page is re-published from the 2020 World Fact Book of the United States Central Intelligence Agency and other sources. No claims are made regarding the accuracy of Ecuador People 2020 information contained here. All suggestions for corrections of any errors about Ecuador People 2020 should be addressed to the CIA or the source cited on each page.
2) The rank that you see is the CIA reported rank, which may have the following issues:
a) They assign increasing rank number, alphabetically for countries with the same value of the ranked item, whereas we assign them the same rank.
b) The CIA sometimes assigns counterintuitive ranks. For example, it assigns unemployment rates in increasing order, whereas we rank them in decreasing order.
- Main Index
- 2020 Index
- Country Ranks
- Definitions
- Ecuador Index 2020
- Ecuador Main Index
- Introduction
- History
- Geography
- Climate
- Maps
- People
- Religion
- Government
- Gov. Leaders
- Flags
- Economy
- Energy
- Communications
- Transportation
- Airport Codes
- Military
- Transnational Issues
- Photos
- Advertise Here
- Feedback

This page was last modified 27-Jan-20