


Population:
108,113,150
(July 2020 est.)
note: estimates for this country explicitly take into account the effects of excess mortality due to AIDS; this can result in lower life expectancy, higher infant mortality, higher death rates, lower population growth rates, and changes in the distribution of population by age and sex than would otherwise be expected
country comparison to the world (CIA rank, may be based on non-current data):
13
[see also: Population country ranks ]
Nationality:
noun:
Ethiopian(s)
adjective:
Ethiopian
Ethnic groups:
Oromo 34.4%, Amhara (Amara) 27%, Somali (Somalie) 6.2%, Tigray (Tigrinya) 6.1%, Sidama 4%, Gurage 2.5%, Welaita 2.3%, Hadiya 1.7%, Afar (Affar) 1.7%, Gamo 1.5%, Gedeo 1.3%, Silte 1.3%, Kefficho 1.2%, other 8.8%
(2007 est.)
Languages:
Oromo (official working language in the State of Oromiya) 33.8%, Amharic (official national language) 29.3%, Somali (official working language of the State of Sumale) 6.2%, Tigrigna (Tigrinya) (official working language of the State of Tigray) 5.9%, Sidamo 4%, Wolaytta 2.2%, Gurage 2%, Afar (official working language of the State of Afar) 1.7%, Hadiyya 1.7%, Gamo 1.5%, Gedeo 1.3%, Opuuo 1.2%, Kafa 1.1%, other 8.1%, English (major foreign language taught in schools), Arabic
(2007 est.)
Religions:
Ethiopian Orthodox 43.5%, Muslim 33.9%, Protestant 18.5%, traditional 2.7%, Catholic 0.7%, other 0.6%
(2007 est.)
Demographic profile:
Ethiopia is a predominantly agricultural country – more than 80% of the population lives in rural areas – that is in the early stages of demographic transition. Infant, child, and maternal mortality have fallen sharply over the past decade, but the total fertility rate has declined more slowly and the population continues to grow. The rising age of marriage and the increasing proportion of women remaining single have contributed to fertility reduction. While the use of modern contraceptive methods among married women has increased significantly from 6 percent in 2000 to 27 percent in 2012, the overall rate is still quite low.
Ethiopia’s rapid population growth is putting increasing pressure on land resources, expanding environmental degradation, and raising vulnerability to food shortages. With more than 40 percent of the population below the age of 15 and a fertility rate of over 5 children per woman (and even higher in rural areas), Ethiopia will have to make further progress in meeting its family planning needs if it is to achieve the age structure necessary for reaping a demographic dividend in the coming decades.
Poverty, drought, political repression, and forced government resettlement have driven Ethiopia’s internal and external migration since the 1960s. Before the 1974 revolution, only small numbers of the Ethiopian elite went abroad to study and then returned home, but under the brutal Derg regime thousands fled the country, primarily as refugees. Between 1982 and 1991 there was a new wave of migration to the West for family reunification. Since the defeat of the Derg in 1991, Ethiopians have migrated to escape violence among some of the country’s myriad ethnic groups or to pursue economic opportunities. Internal and international trafficking of women and children for domestic work and prostitution is a growing problem.
Age structure:
0-14 years: 39.81%
(male 21,657,152/female 21,381,628)
[see also: Age structure - 0-14 years country ranks ]
15-24 years: 19.47%
(male 10,506,144/female 10,542,128)
[see also: Age structure - 15-24 years country ranks ]
25-54 years: 32.92%
(male 17,720,540/female 17,867,298)
[see also: Age structure - 25-54 years country ranks ]
55-64 years: 4.42%
(male 2,350,606/female 2,433,319)
[see also: Age structure - 55-64 years country ranks ]
65 years and over: 3.38%
(male 1,676,478/female 1,977,857)
(2020 est.)
[see also: Age structure - 65 years and over country ranks ]
population pyramid:
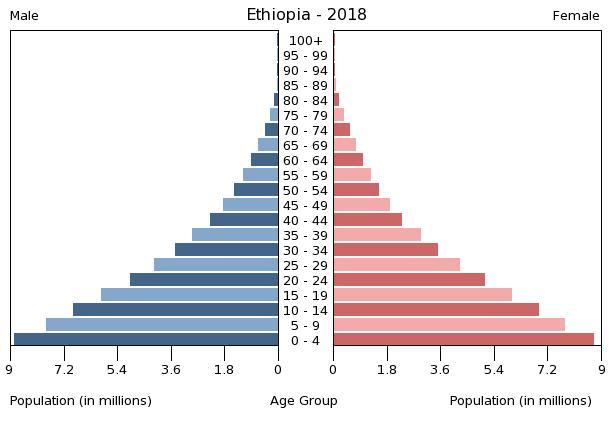
This is the population pyramid for Ethiopia. A population pyramid illustrates the age and sex structure of a country's population and may provide insights about political and social stability, as well as economic development. The population is distributed along the horizontal axis, with males shown on the left and females on the right. The male and female populations are broken down into 5-year age groups represented as horizontal bars along the vertical axis, with the youngest age groups at the bottom and the oldest at the top. The shape of the population pyramid gradually evolves over time based on fertility, mortality, and international migration trends.
For additional information, please see the entry for Population pyramid on the Definitions and Notes page under the References tab.
Dependency ratios:
total dependency ratio: 82.1
(2015 est.)
[see also: Dependency ratios - total dependency ratio country ranks ]
youth dependency ratio: 75.8
(2015 est.)
[see also: Dependency ratios - youth dependency ratio country ranks ]
elderly dependency ratio: 6.3
(2015 est.)
[see also: Dependency ratios - elderly dependency ratio country ranks ]
potential support ratio: 15.8
(2015 est.)
[see also: Dependency ratios - potential support ratio country ranks ]
Median age:
total: 19.8 years
[see also: Median age - total country ranks ]
male: 19.6 years
[see also: Median age - male country ranks ]
female: 20.1 years
(2020 est.)
[see also: Median age - female country ranks ]
country comparison to the world (CIA rank, may be based on non-current data):
198
Population growth rate:
2.56%
(2020 est.)
country comparison to the world (CIA rank, may be based on non-current data):
20
[see also: Population growth rate country ranks ]
Birth rate:
31.6 births/1,000 population
(2020 est.)
country comparison to the world (CIA rank, may be based on non-current data):
30
[see also: Birth rate country ranks ]
Death rate:
5.9 deaths/1,000 population
(2020 est.)
country comparison to the world (CIA rank, may be based on non-current data):
171
[see also: Death rate country ranks ]
Net migration rate:
-0.2 migrant(s)/1,000 population
(2020 est.)
country comparison to the world (CIA rank, may be based on non-current data):
106
[see also: Net migration rate country ranks ]
Population distribution:
highest density is found in the highlands of the north and middle areas of the country, particularly around the centrally located capital city of Addis Ababa; the far east and southeast are sparsely populated
Urbanization:
urban population: 21.2% of total population
(2019)
[see also: Urbanization - urban population country ranks ]
rate of urbanization: 4.63% annual rate of change
(2015-20 est.)
[see also: Urbanization - rate of urbanization country ranks ]
Major urban areas - population:
4.592 million ADDIS ABABA (capital)
(2019)
Sex ratio:
at birth: 1.03 male(s)/female
(2020 est.)
[see also: Sex ratio - at birth country ranks ]
0-14 years: 1.01 male(s)/female
(2020 est.)
[see also: Sex ratio - 0-14 years country ranks ]
15-24 years: 1 male(s)/female
(2020 est.)
[see also: Sex ratio - 15-24 years country ranks ]
25-54 years: 0.99 male(s)/female
(2020 est.)
[see also: Sex ratio - 25-54 years country ranks ]
55-64 years: 0.97 male(s)/female
(2020 est.)
[see also: Sex ratio - 55-64 years country ranks ]
65 years and over: 0.85 male(s)/female
(2020 est.)
[see also: Sex ratio - 65 years and over country ranks ]
total population: 99.5 male(s)/female
(2020 est.)
[see also: Sex ratio country ranks ]
Mother's mean age at first birth:
20 years
(2016 est.)
note: median age at first birth among women 25-29
[see also: Mother's mean age at first birth country ranks ]
Maternal mortality rate:
401 deaths/100,000 live births
(2017 est.)
country comparison to the world (CIA rank, may be based on non-current data):
26
[see also: Maternal mortality rate country ranks ]
Infant mortality rate:
total: 35.8 deaths/1,000 live births
[see also: Infant mortality rate - total country ranks ]
male: 40.8 deaths/1,000 live births
[see also: Infant mortality rate - male country ranks ]
female: 30.5 deaths/1,000 live births
(2020 est.)
[see also: Infant mortality rate - female country ranks ]
country comparison to the world (CIA rank, may be based on non-current data):
44
Life expectancy at birth:
total population: 67.5 years
[see also: Life expectancy at birth - total population country ranks ]
male: 65.5 years
[see also: Life expectancy at birth - male country ranks ]
female: 69.7 years
(2020 est.)
[see also: Life expectancy at birth - female country ranks ]
country comparison to the world (CIA rank, may be based on non-current data):
180
[See also: Healthy Life Expectancy ]
[See also: Health Performance ]
Total fertility rate:
4.14 children born/woman
(2020 est.)
country comparison to the world (CIA rank, may be based on non-current data):
28
[see also: Total fertility rate country ranks ]
Contraceptive prevalence rate:
40.1%
(2018)
[see also: Contraceptive prevalence rate country ranks ]
Drinking water source:
improved:
urban: 93.1% of population
[see also: Drinking water source - improved - urban country ranks ]
rural: 48.6% of population
[see also: Drinking water source - improved - rural country ranks ]
total: 57.3% of population
unimproved:
urban: 6.9% of population
rural: 51.4% of population
total: 42.7% of population
(2015 est.)
Current Health Expenditure:
4%
(2016)
[see also: Current Health Expenditure country ranks ]
Physicians density:
0.1 physicians/1,000 population
(2017)
[see also: Physicians density country ranks ]
Hospital bed density:
0.3 beds/1,000 population
(2015)
[see also: Hospital bed density country ranks ]
Sanitation facility access:
improved:
urban: 27.2% of population
(2015 est.)
[see also: Sanitation facility access - improved - urban country ranks ]
rural: 28.2% of population
(2015 est.)
[see also: Sanitation facility access - improved - rural country ranks ]
total: 28% of population
(2015 est.)
unimproved:
urban: 72.8% of population
(2015 est.)
rural: 71.8% of population
(2015 est.)
total: 72% of population
(2015 est.)
HIV/AIDS - adult prevalence rate:
1%
(2018 est.)
country comparison to the world (CIA rank, may be based on non-current data):
48
[see also: HIV/AIDS - adult prevalence rate country ranks ]
HIV/AIDS - people living with HIV/AIDS:
690,000
(2018 est.)
country comparison to the world (CIA rank, may be based on non-current data):
13
[see also: HIV/AIDS - people living with HIV/AIDS country ranks ]
HIV/AIDS - deaths:
11,000
(2018 est.)
country comparison to the world (CIA rank, may be based on non-current data):
19
[see also: HIV/AIDS - deaths country ranks ]
Major infectious diseases:
degree of risk:
very high
(2016)
food or waterborne diseases:
bacterial and protozoal diarrhea, hepatitis A, and typhoid fever
(2016)
vectorborne diseases:
malaria and dengue fever
(2016)
water contact diseases:
schistosomiasis
(2016)
animal contact diseases:
rabies
(2016)
respiratory diseases:
meningococcal meningitis
(2016)
Obesity - adult prevalence rate:
4.5%
(2016)
country comparison to the world (CIA rank, may be based on non-current data):
185
[see also: Obesity - adult prevalence rate country ranks ]
Children under the age of 5 years underweight:
23.6%
(2016)
country comparison to the world (CIA rank, may be based on non-current data):
22
[see also: Children under the age of 5 years underweight country ranks ]
Education expenditures:
4.7% of GDP
(2015)
country comparison to the world (CIA rank, may be based on non-current data):
78
[see also: Education expenditures country ranks ]
Literacy:
definition:
age 15 and over can read and write
total population: 49.1%
[see also: Literacy - total population country ranks ]
male: 57.2%
[see also: Literacy - male country ranks ]
female: 41.1%
(2015)
[see also: Literacy - female country ranks ]
School life expectancy (primary to tertiary education):
total: 8 years
[see also: School life expectancy (primary to tertiary education) - total country ranks ]
male: 9 years
[see also: School life expectancy (primary to tertiary education) - male country ranks ]
female: 8 years
(2012)
[see also: School life expectancy (primary to tertiary education) - female country ranks ]
Unemployment, youth ages 15-24
total: 25.2%
[see also: Unemployment, youth ages 15-24 - total country ranks ]
male: 17.1%
[see also: Unemployment, youth ages 15-24 - male country ranks ]
female: 30.9%
(2016 est.)
[see also: Unemployment, youth ages 15-24 - female country ranks ]
country comparison to the world (CIA rank, may be based on non-current data):
48
NOTE: 1) The information regarding Ethiopia on this page is re-published from the 2020 World Fact Book of the United States Central Intelligence Agency and other sources. No claims are made regarding the accuracy of Ethiopia People 2020 information contained here. All suggestions for corrections of any errors about Ethiopia People 2020 should be addressed to the CIA or the source cited on each page.
2) The rank that you see is the CIA reported rank, which may have the following issues:
a) They assign increasing rank number, alphabetically for countries with the same value of the ranked item, whereas we assign them the same rank.
b) The CIA sometimes assigns counterintuitive ranks. For example, it assigns unemployment rates in increasing order, whereas we rank them in decreasing order.
- Main Index
- 2020 Index
- Country Ranks
- Definitions
- Ethiopia Index 2020
- Ethiopia Main Index
- Introduction
- History
- Geography
- Climate
- Maps
- People
- Religion
- Government
- Gov. Leaders
- Flags
- Economy
- Energy
- Communications
- Transportation
- Airport Codes
- Military
- Terrorism
- Transnational Issues
- Photos
- Advertise Here
- Feedback

This page was last modified 27-Jan-20