


Population:
53,527,936
(July 2020 est.)
note: estimates for this country explicitly take into account the effects of excess mortality due to AIDS; this can result in lower life expectancy, higher infant mortality, higher death rates, lower population growth rates, and changes in the distribution of population by age and sex than would otherwise be expected
country comparison to the world (CIA rank, may be based on non-current data):
27
[see also: Population country ranks ]
Nationality:
noun:
Kenyan(s)
adjective:
Kenyan
Ethnic groups:
Kikuyu 17.2%, Luhya 13.8%, Kalejin 12.9%, Luo 10.5%, Kamba 10.1%, Somali 6.2%, Kisii 5.7%, Mijikenda 5.1%, Meru 4.3%, Turkana 2.6%, Masai 2.2%, other 9.4%
(2014 est.)
Languages:
English (official), Kiswahili (official), numerous indigenous languages
Religions:
Christian 83% (Protestant 47.7%, Catholic 23.4%, other Christian 11.9%), Muslim 11.2%, Traditionalists 1.7%, other 1.6%, none 2.4%, unspecified 0.2%
(2009 est.)
Demographic profile:
Kenya has experienced dramatic population growth since the mid-20th century as a result of its high birth rate and its declining mortality rate. More than 40% of Kenyans are under the age of 15 because of sustained high fertility, early marriage and childbearing, and an unmet need for family planning. Kenya’s persistent rapid population growth strains the labor market, social services, arable land, and natural resources. Although Kenya in 1967 was the first Sub-Saharan country to launch a nationwide family planning program, progress in reducing the birth rate has largely stalled since the late 1990s, when the government decreased its support for family planning to focus on the HIV epidemic. Government commitment and international technical support spurred Kenyan contraceptive use, decreasing the fertility rate (children per woman) from about 8 in the late 1970s to less than 5 children twenty years later, but it has plateaued at just over 3 children today.
Kenya is a source of emigrants and a host country for refugees. In the 1960s and 1970s, Kenyans pursued higher education in the UK because of colonial ties, but as British immigration rules tightened, the US, the then Soviet Union, and Canada became attractive study destinations. Kenya’s stagnant economy and political problems during the 1980s and 1990s led to an outpouring of Kenyan students and professionals seeking permanent opportunities in the West and southern Africa. Nevertheless, Kenya’s relative stability since its independence in 1963 has attracted hundreds of thousands of refugees escaping violent conflicts in neighboring countries; Kenya shelters more than 300,000 Somali refugees as of April 2017.
Age structure:
0-14 years: 38.71%
(male 10,412,321/female 10,310,908)
[see also: Age structure - 0-14 years country ranks ]
15-24 years: 20.45%
(male 5,486,641/female 5,460,372)
[see also: Age structure - 15-24 years country ranks ]
25-54 years: 33.75%
(male 9,046,946/female 9,021,207)
[see also: Age structure - 25-54 years country ranks ]
55-64 years: 4.01%
(male 1,053,202/female 1,093,305)
[see also: Age structure - 55-64 years country ranks ]
65 years and over: 3.07%
(male 750,988/female 892,046)
(2020 est.)
[see also: Age structure - 65 years and over country ranks ]
population pyramid:
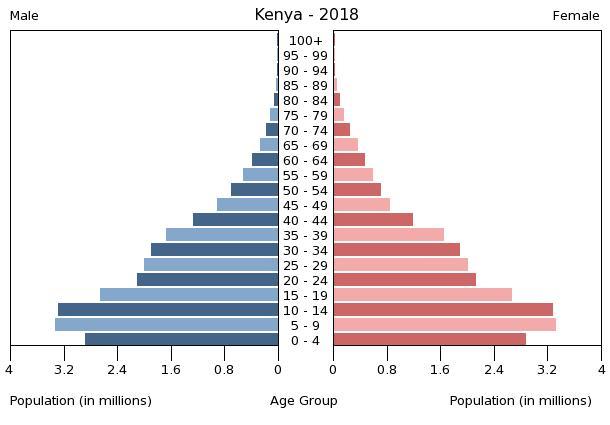
This is the population pyramid for Kenya. A population pyramid illustrates the age and sex structure of a country's population and may provide insights about political and social stability, as well as economic development. The population is distributed along the horizontal axis, with males shown on the left and females on the right. The male and female populations are broken down into 5-year age groups represented as horizontal bars along the vertical axis, with the youngest age groups at the bottom and the oldest at the top. The shape of the population pyramid gradually evolves over time based on fertility, mortality, and international migration trends.
For additional information, please see the entry for Population pyramid on the Definitions and Notes page under the References tab.
Dependency ratios:
total dependency ratio: 78.3
(2015 est.)
[see also: Dependency ratios - total dependency ratio country ranks ]
youth dependency ratio: 73.7
(2015 est.)
[see also: Dependency ratios - youth dependency ratio country ranks ]
elderly dependency ratio: 4.6
(2015 est.)
[see also: Dependency ratios - elderly dependency ratio country ranks ]
potential support ratio: 21.7
(2015 est.)
[see also: Dependency ratios - potential support ratio country ranks ]
Median age:
total: 20 years
[see also: Median age - total country ranks ]
male: 19.9 years
[see also: Median age - male country ranks ]
female: 20.1 years
(2020 est.)
[see also: Median age - female country ranks ]
country comparison to the world (CIA rank, may be based on non-current data):
196
Population growth rate:
2.2%
(2020 est.)
country comparison to the world (CIA rank, may be based on non-current data):
36
[see also: Population growth rate country ranks ]
Birth rate:
27.2 births/1,000 population
(2020 est.)
country comparison to the world (CIA rank, may be based on non-current data):
43
[see also: Birth rate country ranks ]
Death rate:
5.2 deaths/1,000 population
(2020 est.)
country comparison to the world (CIA rank, may be based on non-current data):
195
[see also: Death rate country ranks ]
Net migration rate:
-0.2 migrant(s)/1,000 population
(2020 est.)
country comparison to the world (CIA rank, may be based on non-current data):
107
[see also: Net migration rate country ranks ]
Population distribution:
population heavily concentrated in the west along the shore of Lake Victoria; other areas of high density include the capital of Nairobi, and in the southeast along the Indian Ocean coast
Urbanization:
urban population: 27.5% of total population
(2019)
[see also: Urbanization - urban population country ranks ]
rate of urbanization: 4.23% annual rate of change
(2015-20 est.)
[see also: Urbanization - rate of urbanization country ranks ]
Major urban areas - population:
4.556 million NAIROBI (capital), 1.254 million Mombassa
(2019)
Sex ratio:
at birth: 1.02 male(s)/female
(2020 est.)
[see also: Sex ratio - at birth country ranks ]
0-14 years: 1.01 male(s)/female
(2020 est.)
[see also: Sex ratio - 0-14 years country ranks ]
15-24 years: 1 male(s)/female
(2020 est.)
[see also: Sex ratio - 15-24 years country ranks ]
25-54 years: 1 male(s)/female
(2020 est.)
[see also: Sex ratio - 25-54 years country ranks ]
55-64 years: 0.96 male(s)/female
(2020 est.)
[see also: Sex ratio - 55-64 years country ranks ]
65 years and over: 0.84 male(s)/female
(2020 est.)
[see also: Sex ratio - 65 years and over country ranks ]
total population: 99.9 male(s)/female
(2020 est.)
[see also: Sex ratio country ranks ]
Mother's mean age at first birth:
20.3 years
(2014 est.)
note: median age at first birth among women 25-29
[see also: Mother's mean age at first birth country ranks ]
Maternal mortality rate:
342 deaths/100,000 live births
(2017 est.)
country comparison to the world (CIA rank, may be based on non-current data):
32
[see also: Maternal mortality rate country ranks ]
Infant mortality rate:
total: 29.8 deaths/1,000 live births
[see also: Infant mortality rate - total country ranks ]
male: 33 deaths/1,000 live births
[see also: Infant mortality rate - male country ranks ]
female: 26.6 deaths/1,000 live births
(2020 est.)
[see also: Infant mortality rate - female country ranks ]
country comparison to the world (CIA rank, may be based on non-current data):
57
Life expectancy at birth:
total population: 69 years
[see also: Life expectancy at birth - total population country ranks ]
male: 67.3 years
[see also: Life expectancy at birth - male country ranks ]
female: 70.6 years
(2020 est.)
[see also: Life expectancy at birth - female country ranks ]
country comparison to the world (CIA rank, may be based on non-current data):
173
[See also: Healthy Life Expectancy ]
[See also: Health Performance ]
Total fertility rate:
3.43 children born/woman
(2020 est.)
country comparison to the world (CIA rank, may be based on non-current data):
42
[see also: Total fertility rate country ranks ]
Contraceptive prevalence rate:
60.5%
(2017)
[see also: Contraceptive prevalence rate country ranks ]
Drinking water source:
improved:
urban: 81.6% of population
[see also: Drinking water source - improved - urban country ranks ]
rural: 56.8% of population
[see also: Drinking water source - improved - rural country ranks ]
total: 63.2% of population
unimproved:
urban: 18.4% of population
rural: 43.2% of population
total: 36.8% of population
(2015 est.)
Current Health Expenditure:
4.5%
(2016)
[see also: Current Health Expenditure country ranks ]
Physicians density:
0.2 physicians/1,000 population
(2014)
[see also: Physicians density country ranks ]
Hospital bed density:
1.4 beds/1,000 population
(2010)
[see also: Hospital bed density country ranks ]
Sanitation facility access:
improved:
urban: 31.2% of population
(2015 est.)
[see also: Sanitation facility access - improved - urban country ranks ]
rural: 29.7% of population
(2015 est.)
[see also: Sanitation facility access - improved - rural country ranks ]
total: 30.1% of population
(2015 est.)
unimproved:
urban: 68.8% of population
(2015 est.)
rural: 70.3% of population
(2015 est.)
total: 69.9% of population
(2015 est.)
HIV/AIDS - adult prevalence rate:
4.7%
(2018 est.)
country comparison to the world (CIA rank, may be based on non-current data):
12
[see also: HIV/AIDS - adult prevalence rate country ranks ]
HIV/AIDS - people living with HIV/AIDS:
1.6 million
(2018 est.)
country comparison to the world (CIA rank, may be based on non-current data):
5
[see also: HIV/AIDS - people living with HIV/AIDS country ranks ]
HIV/AIDS - deaths:
25,000
(2018 est.)
country comparison to the world (CIA rank, may be based on non-current data):
6
[see also: HIV/AIDS - deaths country ranks ]
Major infectious diseases:
degree of risk:
very high
(2016)
food or waterborne diseases:
bacterial and protozoal diarrhea, hepatitis A, and typhoid fever
(2016)
vectorborne diseases:
malaria, dengue fever, and Rift Valley fever
(2016)
water contact diseases:
schistosomiasis
(2016)
animal contact diseases:
rabies
(2016)
Obesity - adult prevalence rate:
7.1%
(2016)
country comparison to the world (CIA rank, may be based on non-current data):
161
[see also: Obesity - adult prevalence rate country ranks ]
Children under the age of 5 years underweight:
11.2%
(2014)
country comparison to the world (CIA rank, may be based on non-current data):
58
[see also: Children under the age of 5 years underweight country ranks ]
Education expenditures:
5.2% of GDP
(2017)
country comparison to the world (CIA rank, may be based on non-current data):
55
[see also: Education expenditures country ranks ]
Literacy:
definition:
age 15 and over can read and write
total population: 78%
[see also: Literacy - total population country ranks ]
male: 81.1%
[see also: Literacy - male country ranks ]
female: 74.9%
(2015)
[see also: Literacy - female country ranks ]
School life expectancy (primary to tertiary education):
total: 11 years
[see also: School life expectancy (primary to tertiary education) - total country ranks ]
male: 11 years
[see also: School life expectancy (primary to tertiary education) - male country ranks ]
female: 11 years
[see also: School life expectancy (primary to tertiary education) - male country ranks ]
(2009)
NOTE: 1) The information regarding Kenya on this page is re-published from the 2020 World Fact Book of the United States Central Intelligence Agency and other sources. No claims are made regarding the accuracy of Kenya People 2020 information contained here. All suggestions for corrections of any errors about Kenya People 2020 should be addressed to the CIA or the source cited on each page.
2) The rank that you see is the CIA reported rank, which may have the following issues:
a) They assign increasing rank number, alphabetically for countries with the same value of the ranked item, whereas we assign them the same rank.
b) The CIA sometimes assigns counterintuitive ranks. For example, it assigns unemployment rates in increasing order, whereas we rank them in decreasing order.
- Main Index
- 2020 Index
- Country Ranks
- Definitions
- Kenya Index 2020
- Kenya Main Index
- Introduction
- History
- Geography
- Climate
- Maps
- People
- Religion
- Government
- Gov. Leaders
- Flags
- Economy
- Energy
- Communications
- Transportation
- Airport Codes
- Military
- Terrorism
- Transnational Issues
- Photos
- Advertise Here
- Feedback

This page was last modified 27-Jan-20