


Population:
5,073,296
(July 2020 est.)
country comparison to the world (CIA rank, may be based on non-current data):
124
[see also: Population country ranks ]
Nationality:
noun:
Liberian(s)
adjective:
Liberian
Ethnic groups:
Kpelle 20.3%, Bassa 13.4%, Grebo 10%, Gio 8%, Mano 7.9%, Kru 6%, Lorma 5.1%, Kissi 4.8%, Gola 4.4%, Krahn 4%, Vai 4%, Mandingo 3.2%, Gbandi 3%, Mende 1.3%, Sapo 1.3%, other Liberian 1.7%, other African 1.4%, non-African .1%
(2008 est.)
Languages:
English 20% (official), some 20 ethnic group languages few of which can be written or used in correspondence
Religions:
Christian 85.6%, Muslim 12.2%, Traditional 0.6%, other 0.2%, none 1.5%
(2008 est.)
Demographic profile:
Liberia’s high fertility rate of nearly 5 children per woman and large youth cohort – more than 60% of the population is under the age of 25 – will sustain a high dependency ratio for many years to come. Significant progress has been made in preventing child deaths, despite a lack of health care workers and infrastructure. Infant and child mortality have dropped nearly 70% since 1990; the annual reduction rate of about 5.4% is the highest in Africa.
Nevertheless, Liberia’s high maternal mortality rate remains among the world’s worst; it reflects a high unmet need for family planning services, frequency of early childbearing, lack of quality obstetric care, high adolescent fertility, and a low proportion of births attended by a medical professional. Female mortality is also increased by the prevalence of female genital cutting (FGC), which is practiced by 10 of Liberia’s 16 tribes and affects more than two-thirds of women and girls. FGC is an initiation ritual performed in rural bush schools, which teach traditional beliefs on marriage and motherhood and are an obstacle to formal classroom education for Liberian girls.
Liberia has been both a source and a destination for refugees. During Liberia’s 14-year civil war (1989-2003), more than 250,000 people became refugees and another half million were internally displaced. Between 2004 and the cessation of refugee status for Liberians in June 2012, the UNHCR helped more than 155,000 Liberians to voluntarily repatriate, while others returned home on their own. Some Liberian refugees spent more than two decades living in other West African countries. Liberia hosted more than 125,000 Ivoirian refugees escaping post-election violence in 2010-11; as of mid-2017, about 12,000 Ivoirian refugees were still living in Liberia as of October 2017 because of instability.
Age structure:
0-14 years: 43.35%
(male 1,111,479/female 1,087,871)
[see also: Age structure - 0-14 years country ranks ]
15-24 years: 20.35%
(male 516,136/female 516,137)
[see also: Age structure - 15-24 years country ranks ]
25-54 years: 30.01%
(male 747,983/female 774,615)
[see also: Age structure - 25-54 years country ranks ]
55-64 years: 3.46%
(male 89,150/female 86,231)
[see also: Age structure - 55-64 years country ranks ]
65 years and over: 2.83%
(male 70,252/female 73,442)
(2020 est.)
[see also: Age structure - 65 years and over country ranks ]
population pyramid:
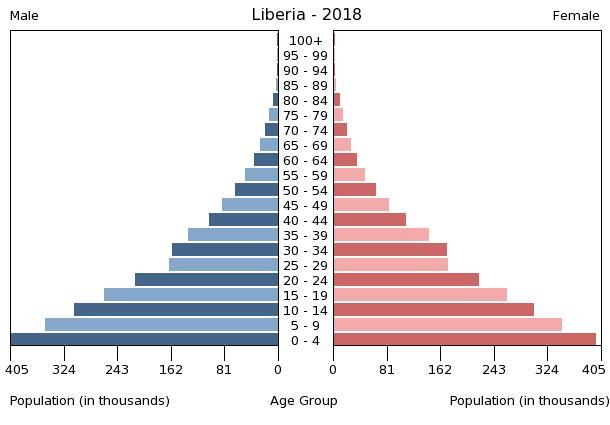
This is the population pyramid for Liberia. A population pyramid illustrates the age and sex structure of a country's population and may provide insights about political and social stability, as well as economic development. The population is distributed along the horizontal axis, with males shown on the left and females on the right. The male and female populations are broken down into 5-year age groups represented as horizontal bars along the vertical axis, with the youngest age groups at the bottom and the oldest at the top. The shape of the population pyramid gradually evolves over time based on fertility, mortality, and international migration trends.
For additional information, please see the entry for Population pyramid on the Definitions and Notes page under the References tab.
Dependency ratios:
total dependency ratio: 83.2
(2015 est.)
[see also: Dependency ratios - total dependency ratio country ranks ]
youth dependency ratio: 77.6
(2015 est.)
[see also: Dependency ratios - youth dependency ratio country ranks ]
elderly dependency ratio: 5.5
(2015 est.)
[see also: Dependency ratios - elderly dependency ratio country ranks ]
potential support ratio: 18.1
(2015 est.)
[see also: Dependency ratios - potential support ratio country ranks ]
Median age:
total: 18 years
[see also: Median age - total country ranks ]
male: 17.7 years
[see also: Median age - male country ranks ]
female: 18.2 years
(2020 est.)
[see also: Median age - female country ranks ]
country comparison to the world (CIA rank, may be based on non-current data):
216
Population growth rate:
2.71%
(2020 est.)
country comparison to the world (CIA rank, may be based on non-current data):
14
[see also: Population growth rate country ranks ]
Birth rate:
37.3 births/1,000 population
(2020 est.)
country comparison to the world (CIA rank, may be based on non-current data):
13
[see also: Birth rate country ranks ]
Death rate:
7 deaths/1,000 population
(2020 est.)
country comparison to the world (CIA rank, may be based on non-current data):
127
[see also: Death rate country ranks ]
Net migration rate:
-2.9 migrant(s)/1,000 population
(2020 est.)
country comparison to the world (CIA rank, may be based on non-current data):
174
[see also: Net migration rate country ranks ]
Population distribution:
more than half of the population lives in urban areas, with approximately one-third living within an 80-km radius of Monrovia
Urbanization:
urban population: 51.6% of total population
(2019)
[see also: Urbanization - urban population country ranks ]
rate of urbanization: 3.41% annual rate of change
(2015-20 est.)
[see also: Urbanization - rate of urbanization country ranks ]
Major urban areas - population:
1.467 million MONROVIA (capital)
(2019)
Sex ratio:
at birth: 1.03 male(s)/female
(2020 est.)
[see also: Sex ratio - at birth country ranks ]
0-14 years: 1.02 male(s)/female
(2020 est.)
[see also: Sex ratio - 0-14 years country ranks ]
15-24 years: 1 male(s)/female
(2020 est.)
[see also: Sex ratio - 15-24 years country ranks ]
25-54 years: 0.97 male(s)/female
(2020 est.)
[see also: Sex ratio - 25-54 years country ranks ]
55-64 years: 1.03 male(s)/female
(2020 est.)
[see also: Sex ratio - 55-64 years country ranks ]
65 years and over: 0.96 male(s)/female
(2020 est.)
[see also: Sex ratio - 65 years and over country ranks ]
total population: 99.9 male(s)/female
(2020 est.)
[see also: Sex ratio country ranks ]
Mother's mean age at first birth:
19.2 years
(2013 est.)
note: median age at first birth among women 25-29
[see also: Mother's mean age at first birth country ranks ]
Maternal mortality rate:
661 deaths/100,000 live births
(2017 est.)
country comparison to the world (CIA rank, may be based on non-current data):
10
[see also: Maternal mortality rate country ranks ]
Infant mortality rate:
total: 47.4 deaths/1,000 live births
[see also: Infant mortality rate - total country ranks ]
male: 51.7 deaths/1,000 live births
[see also: Infant mortality rate - male country ranks ]
female: 43.1 deaths/1,000 live births
(2020 est.)
[see also: Infant mortality rate - female country ranks ]
country comparison to the world (CIA rank, may be based on non-current data):
27
Life expectancy at birth:
total population: 64.7 years
[see also: Life expectancy at birth - total population country ranks ]
male: 62.5 years
[see also: Life expectancy at birth - male country ranks ]
female: 67 years
(2020 est.)
[see also: Life expectancy at birth - female country ranks ]
country comparison to the world (CIA rank, may be based on non-current data):
200
[See also: Healthy Life Expectancy ]
[See also: Health Performance ]
Total fertility rate:
4.9 children born/woman
(2020 est.)
country comparison to the world (CIA rank, may be based on non-current data):
15
[see also: Total fertility rate country ranks ]
Contraceptive prevalence rate:
31.2%
(2016)
[see also: Contraceptive prevalence rate country ranks ]
Drinking water source:
improved:
urban: 88.6% of population
[see also: Drinking water source - improved - urban country ranks ]
rural: 62.6% of population
[see also: Drinking water source - improved - rural country ranks ]
total: 75.6% of population
unimproved:
urban: 11.4% of population
rural: 37.4% of population
total: 24.4% of population
(2015 est.)
Current Health Expenditure:
9.6%
(2016)
[see also: Current Health Expenditure country ranks ]
Physicians density:
0.04 physicians/1,000 population
(2015)
[see also: Physicians density country ranks ]
Hospital bed density:
0.8 beds/1,000 population
(2010)
[see also: Hospital bed density country ranks ]
Sanitation facility access:
improved:
urban: 28% of population
(2015 est.)
[see also: Sanitation facility access - improved - urban country ranks ]
rural: 5.9% of population
(2015 est.)
[see also: Sanitation facility access - improved - rural country ranks ]
total: 16.9% of population
(2015 est.)
unimproved:
urban: 72% of population
(2015 est.)
rural: 94.1% of population
(2015 est.)
total: 83.1% of population
(2015 est.)
HIV/AIDS - adult prevalence rate:
1.3%
(2018 est.)
country comparison to the world (CIA rank, may be based on non-current data):
39
[see also: HIV/AIDS - adult prevalence rate country ranks ]
HIV/AIDS - people living with HIV/AIDS:
39,000
(2018 est.)
country comparison to the world (CIA rank, may be based on non-current data):
68
[see also: HIV/AIDS - people living with HIV/AIDS country ranks ]
HIV/AIDS - deaths:
1,800
(2018 est.)
country comparison to the world (CIA rank, may be based on non-current data):
49
[see also: HIV/AIDS - deaths country ranks ]
Major infectious diseases:
degree of risk:
very high
(2016)
food or waterborne diseases:
bacterial and protozoal diarrhea, hepatitis A, and typhoid fever
(2016)
vectorborne diseases:
malaria, dengue fever, and yellow fever
(2016)
water contact diseases:
schistosomiasis
(2016)
animal contact diseases:
rabies
(2016)
aerosolized dust or soil contact diseases:
Lassa fever
(2016)
Obesity - adult prevalence rate:
9.9%
(2016)
country comparison to the world (CIA rank, may be based on non-current data):
141
[see also: Obesity - adult prevalence rate country ranks ]
Children under the age of 5 years underweight:
15.3%
(2013)
country comparison to the world (CIA rank, may be based on non-current data):
42
[see also: Children under the age of 5 years underweight country ranks ]
Education expenditures:
3.8% of GDP
(2017)
country comparison to the world (CIA rank, may be based on non-current data):
114
[see also: Education expenditures country ranks ]
Literacy:
definition:
age 15 and over can read and write
total population: 47.6%
[see also: Literacy - total population country ranks ]
male: 62.4%
[see also: Literacy - male country ranks ]
female: 32.8%
(2015)
[see also: Literacy - female country ranks ]
Unemployment, youth ages 15-24
total: 2.3%
[see also: Unemployment, youth ages 15-24 - total country ranks ]
male: 2.4%
[see also: Unemployment, youth ages 15-24 - male country ranks ]
female: 2.2%
(2016 est.)
[see also: Unemployment, youth ages 15-24 - female country ranks ]
country comparison to the world (CIA rank, may be based on non-current data):
174
NOTE: 1) The information regarding Liberia on this page is re-published from the 2020 World Fact Book of the United States Central Intelligence Agency and other sources. No claims are made regarding the accuracy of Liberia People 2020 information contained here. All suggestions for corrections of any errors about Liberia People 2020 should be addressed to the CIA or the source cited on each page.
2) The rank that you see is the CIA reported rank, which may have the following issues:
a) They assign increasing rank number, alphabetically for countries with the same value of the ranked item, whereas we assign them the same rank.
b) The CIA sometimes assigns counterintuitive ranks. For example, it assigns unemployment rates in increasing order, whereas we rank them in decreasing order.
- Main Index
- 2020 Index
- Country Ranks
- Definitions
- Liberia Index 2020
- Liberia Main Index
- Introduction
- History
- Geography
- Maps
- People
- Religion
- Government
- Gov. Leaders
- Flags
- Economy
- Energy
- Communications
- Transportation
- Airport Codes
- Military
- Transnational Issues
- Photos
- Advertise Here
- Feedback

This page was last modified 27-Jan-20