


Population:
31,914,989
(July 2020 est.)
country comparison to the world (CIA rank, may be based on non-current data):
44
[see also: Population country ranks ]
Nationality:
noun:
Peruvian(s)
adjective:
Peruvian
Ethnic groups:
mestizo (mixed Amerindian and white) 60.2%, Amerindian 25.8%, white 5.9%, African descent 3.6%, other (includes Chinese and Japanese descent) 1.2%, unspecified 3.3%
(2017 est.)
Languages:
Spanish (official) 82.9%, Quechua (official) 13.6%, Aymara (official) 1.6%, Ashaninka 0.3%, other native languages (includes a large number of minor Amazonian languages) 0.8%, other (includes foreign languages and sign language) 0.2%, none .1%, unspecified .7%
(2017 est.)
Religions:
Roman Catholic 60%, Christian 14.6% (includes evangelical 11.1%, other 3.5%), other .3%, none 4%, unspecified 21.1%
(2017 est.)
Demographic profile:
Peru's urban and coastal communities have benefited much more from recent economic growth than rural, Afro-Peruvian, indigenous, and poor populations of the Amazon and mountain regions. The poverty rate has dropped substantially during the last decade but remains stubbornly high at about 30% (more than 55% in rural areas). After remaining almost static for about a decade, Peru's malnutrition rate began falling in 2005, when the government introduced a coordinated strategy focusing on hygiene, sanitation, and clean water. School enrollment has improved, but achievement scores reflect ongoing problems with educational quality. Many poor children temporarily or permanently drop out of school to help support their families. About a quarter to a third of Peruvian children aged 6 to 14 work, often putting in long hours at hazardous mining or construction sites.
Peru was a country of immigration in the 19th and early 20th centuries, but has become a country of emigration in the last few decades. Beginning in the 19th century, Peru brought in Asian contract laborers mainly to work on coastal plantations. Populations of Chinese and Japanese descent - among the largest in Latin America - are economically and culturally influential in Peru today. Peruvian emigration began rising in the 1980s due to an economic crisis and a violent internal conflict, but outflows have stabilized in the last few years as economic conditions have improved. Nonetheless, more than 2 million Peruvians have emigrated in the last decade, principally to the US, Spain, and Argentina.
Age structure:
0-14 years: 25.43%
(male 4,131,985/female 3,984,546)
[see also: Age structure - 0-14 years country ranks ]
15-24 years: 17.21%
(male 2,756,024/female 2,736,394)
[see also: Age structure - 15-24 years country ranks ]
25-54 years: 41.03%
(male 6,279,595/female 6,815,159)
[see also: Age structure - 25-54 years country ranks ]
55-64 years: 8.28%
(male 1,266,595/female 1,375,708)
[see also: Age structure - 55-64 years country ranks ]
65 years and over: 8.05%
(male 1,207,707/female 1,361,276)
(2020 est.)
[see also: Age structure - 65 years and over country ranks ]
population pyramid:
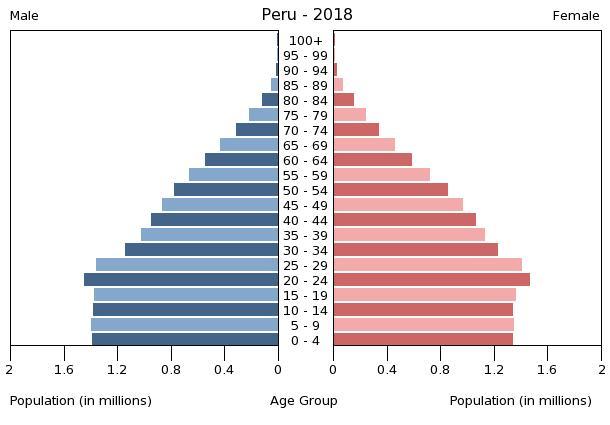
This is the population pyramid for Peru. A population pyramid illustrates the age and sex structure of a country's population and may provide insights about political and social stability, as well as economic development. The population is distributed along the horizontal axis, with males shown on the left and females on the right. The male and female populations are broken down into 5-year age groups represented as horizontal bars along the vertical axis, with the youngest age groups at the bottom and the oldest at the top. The shape of the population pyramid gradually evolves over time based on fertility, mortality, and international migration trends.
For additional information, please see the entry for Population pyramid on the Definitions and Notes page under the References tab.
Dependency ratios:
total dependency ratio: 53.2
(2015 est.)
[see also: Dependency ratios - total dependency ratio country ranks ]
youth dependency ratio: 42.7
(2015 est.)
[see also: Dependency ratios - youth dependency ratio country ranks ]
elderly dependency ratio: 10.5
(2015 est.)
[see also: Dependency ratios - elderly dependency ratio country ranks ]
potential support ratio: 9.6
(2015 est.)
[see also: Dependency ratios - potential support ratio country ranks ]
Median age:
total: 29.1 years
[see also: Median age - total country ranks ]
male: 28.3 years
[see also: Median age - male country ranks ]
female: 29.9 years
(2020 est.)
[see also: Median age - female country ranks ]
country comparison to the world (CIA rank, may be based on non-current data):
138
Population growth rate:
0.92%
(2020 est.)
country comparison to the world (CIA rank, may be based on non-current data):
116
[see also: Population growth rate country ranks ]
Birth rate:
17 births/1,000 population
(2020 est.)
country comparison to the world (CIA rank, may be based on non-current data):
101
[see also: Birth rate country ranks ]
Death rate:
6.2 deaths/1,000 population
(2020 est.)
country comparison to the world (CIA rank, may be based on non-current data):
157
[see also: Death rate country ranks ]
Net migration rate:
-1.8 migrant(s)/1,000 population
(2020 est.)
country comparison to the world (CIA rank, may be based on non-current data):
163
[see also: Net migration rate country ranks ]
Population distribution:
approximately one-third of the population resides along the desert coastal belt in the west, with a strong focus on the capital city of Lima; the Andean highlands, or sierra, which is strongly identified with the country's Amerindian population, contains roughly half of the overall population; the eastern slopes of the Andes, and adjoining rainforest, are sparsely populated
Urbanization:
urban population: 78.1% of total population
(2019)
[see also: Urbanization - urban population country ranks ]
rate of urbanization: 1.44% annual rate of change
(2015-20 est.)
[see also: Urbanization - rate of urbanization country ranks ]
Major urban areas - population:
10.555 million LIMA (capital), 911,000 Arequipa, 851,000 Trujillo
(2019)
Sex ratio:
at birth: 1.05 male(s)/female
(2020 est.)
[see also: Sex ratio - at birth country ranks ]
0-14 years: 1.04 male(s)/female
(2020 est.)
[see also: Sex ratio - 0-14 years country ranks ]
15-24 years: 1.01 male(s)/female
(2020 est.)
[see also: Sex ratio - 15-24 years country ranks ]
25-54 years: 0.92 male(s)/female
(2020 est.)
[see also: Sex ratio - 25-54 years country ranks ]
55-64 years: 0.92 male(s)/female
(2020 est.)
[see also: Sex ratio - 55-64 years country ranks ]
65 years and over: 0.89 male(s)/female
(2020 est.)
[see also: Sex ratio - 65 years and over country ranks ]
total population: 96.1 male(s)/female
(2020 est.)
[see also: Sex ratio country ranks ]
Mother's mean age at first birth:
22.2 years
(2013 est.)
note: median age at first birth among women 25-29
[see also: Mother's mean age at first birth country ranks ]
Maternal mortality rate:
88 deaths/100,000 live births
(2017 est.)
country comparison to the world (CIA rank, may be based on non-current data):
76
[see also: Maternal mortality rate country ranks ]
Infant mortality rate:
total: 16.7 deaths/1,000 live births
[see also: Infant mortality rate - total country ranks ]
male: 18.7 deaths/1,000 live births
[see also: Infant mortality rate - male country ranks ]
female: 14.6 deaths/1,000 live births
(2020 est.)
[see also: Infant mortality rate - female country ranks ]
country comparison to the world (CIA rank, may be based on non-current data):
90
Life expectancy at birth:
total population: 74.7 years
[see also: Life expectancy at birth - total population country ranks ]
male: 72.6 years
[see also: Life expectancy at birth - male country ranks ]
female: 76.9 years
(2020 est.)
[see also: Life expectancy at birth - female country ranks ]
country comparison to the world (CIA rank, may be based on non-current data):
127
[See also: Healthy Life Expectancy ]
[See also: Health Performance ]
Total fertility rate:
2.04 children born/woman
(2020 est.)
country comparison to the world (CIA rank, may be based on non-current data):
107
[see also: Total fertility rate country ranks ]
Contraceptive prevalence rate:
75.4%
(2017)
[see also: Contraceptive prevalence rate country ranks ]
Drinking water source:
improved:
urban: 91.4% of population
[see also: Drinking water source - improved - urban country ranks ]
rural: 69.2% of population
[see also: Drinking water source - improved - rural country ranks ]
total: 86.7% of population
unimproved:
urban: 8.6% of population
rural: 30.8% of population
total: 13.3% of population
(2015 est.)
Current Health Expenditure:
5.1%
(2016)
[see also: Current Health Expenditure country ranks ]
Physicians density:
1.27 physicians/1,000 population
(2016)
[see also: Physicians density country ranks ]
Hospital bed density:
1.6 beds/1,000 population
(2014)
[see also: Hospital bed density country ranks ]
Sanitation facility access:
improved:
urban: 82.5% of population
(2015 est.)
[see also: Sanitation facility access - improved - urban country ranks ]
rural: 53.2% of population
(2015 est.)
[see also: Sanitation facility access - improved - rural country ranks ]
total: 76.2% of population
(2015 est.)
unimproved:
urban: 17.5% of population
(2015 est.)
rural: 46.8% of population
(2015 est.)
total: 23.8% of population
(2015 est.)
HIV/AIDS - adult prevalence rate:
0.3%
(2018 est.)
country comparison to the world (CIA rank, may be based on non-current data):
94
[see also: HIV/AIDS - adult prevalence rate country ranks ]
HIV/AIDS - people living with HIV/AIDS:
79,000
(2018 est.)
country comparison to the world (CIA rank, may be based on non-current data):
49
[see also: HIV/AIDS - people living with HIV/AIDS country ranks ]
HIV/AIDS - deaths:
1,000
(2018 est.)
country comparison to the world (CIA rank, may be based on non-current data):
61
[see also: HIV/AIDS - deaths country ranks ]
Major infectious diseases:
degree of risk:
very high
(2016)
food or waterborne diseases:
bacterial diarrhea, hepatitis A, and typhoid fever
(2016)
vectorborne diseases:
dengue fever, malaria, and Bartonellosis (Oroya fever)
(2016)
note: active local transmission of Zika virus by Aedes species mosquitoes has been identified in this country (as of August 2016); it poses an important risk (a large number of cases possible) among US citizens if bitten by an infective mosquito; other less common ways to get Zika are through sex, via blood transfusion, or during pregnancy, in which the pregnant woman passes Zika virus to her fetus
Obesity - adult prevalence rate:
19.7%
(2016)
country comparison to the world (CIA rank, may be based on non-current data):
110
[see also: Obesity - adult prevalence rate country ranks ]
Children under the age of 5 years underweight:
3.2%
(2017)
country comparison to the world (CIA rank, may be based on non-current data):
96
[see also: Children under the age of 5 years underweight country ranks ]
Education expenditures:
3.9% of GDP
(2017)
country comparison to the world (CIA rank, may be based on non-current data):
108
[see also: Education expenditures country ranks ]
Literacy:
definition:
age 15 and over can read and write
total population: 94.2%
[see also: Literacy - total population country ranks ]
male: 97.2%
[see also: Literacy - male country ranks ]
female: 91.2%
(2016)
[see also: Literacy - female country ranks ]
School life expectancy (primary to tertiary education):
total: 15 years
[see also: School life expectancy (primary to tertiary education) - total country ranks ]
male: 14 years
[see also: School life expectancy (primary to tertiary education) - male country ranks ]
female: 15 years
(2016)
[see also: School life expectancy (primary to tertiary education) - female country ranks ]
Unemployment, youth ages 15-24
total: 14.7%
[see also: Unemployment, youth ages 15-24 - total country ranks ]
male: 14.3%
[see also: Unemployment, youth ages 15-24 - male country ranks ]
female: 15%
(2018 est.)
[see also: Unemployment, youth ages 15-24 - female country ranks ]
country comparison to the world (CIA rank, may be based on non-current data):
96
NOTE: 1) The information regarding Peru on this page is re-published from the 2020 World Fact Book of the United States Central Intelligence Agency and other sources. No claims are made regarding the accuracy of Peru People 2020 information contained here. All suggestions for corrections of any errors about Peru People 2020 should be addressed to the CIA or the source cited on each page.
2) The rank that you see is the CIA reported rank, which may have the following issues:
a) They assign increasing rank number, alphabetically for countries with the same value of the ranked item, whereas we assign them the same rank.
b) The CIA sometimes assigns counterintuitive ranks. For example, it assigns unemployment rates in increasing order, whereas we rank them in decreasing order.
- Main Index
- 2020 Index
- Country Ranks
- Definitions
- Peru Index 2020
- Peru Main Index
- Introduction
- History
- Geography
- Climate
- Maps
- People
- Religion
- Government
- Gov. Leaders
- Flags
- Economy
- Energy
- Communications
- Transportation
- Airport Codes
- Military
- Terrorism
- Transnational Issues
- Photos
- Advertise Here
- Feedback

This page was last modified 27-Jan-20