


Population:
17,426,623
(July 2020 est.)
note: estimates for this country explicitly take into account the effects of excess mortality due to AIDS; this can result in lower life expectancy, higher infant mortality, higher death rates, lower population growth rates, and changes in the distribution of population by age and sex than would otherwise be expected
country comparison to the world (CIA rank, may be based on non-current data):
66
[see also: Population country ranks ]
Nationality:
noun:
Zambian(s)
adjective:
Zambian
Ethnic groups:
Bemba 21%, Tonga 13.6%, Chewa 7.4%, Lozi 5.7%, Nsenga 5.3%, Tumbuka 4.4%, Ngoni 4%, Lala 3.1%, Kaonde 2.9%, Namwanga 2.8%, Lunda (north Western) 2.6%, Mambwe 2.5%, Luvale 2.2%, Lamba 2.1%, Ushi 1.9%, Lenje 1.6%, Bisa 1.6%, Mbunda 1.2%, other 13.8%, unspecified 0.4%
(2010 est.)
Languages:
Bemba 33.4%, Nyanja 14.7%, Tonga 11.4%, Lozi 5.5%, Chewa 4.5%, Nsenga 2.9%, Tumbuka 2.5%, Lunda (North Western) 1.9%, Kaonde 1.8%, Lala 1.8%, Lamba 1.8%, English (official) 1.7%, Luvale 1.5%, Mambwe 1.3%, Namwanga 1.2%, Lenje 1.1%, Bisa 1%, other 9.7%, unspecified 0.2%
(2010 est.)
note: Zambia is said to have over 70 languages, although many of these may be considered dialects; all of Zambia's major languages are members of the Bantu family
Religions:
Protestant 75.3%, Roman Catholic 20.2%, other 2.7% (includes Muslim Buddhist, Hindu, and Baha'i), none 1.8%
(2010 est.)
Demographic profile:
Zambia’s poor, youthful population consists primarily of Bantu-speaking people representing nearly 70 different ethnicities. Zambia’s high fertility rate continues to drive rapid population growth, averaging almost 3 percent annually between 2000 and 2010. The country’s total fertility rate has fallen by less than 1.5 children per woman during the last 30 years and still averages among the world’s highest, almost 6 children per woman, largely because of the country’s lack of access to family planning services, education for girls, and employment for women. Zambia also exhibits wide fertility disparities based on rural or urban location, education, and income. Poor, uneducated women from rural areas are more likely to marry young, to give birth early, and to have more children, viewing children as a sign of prestige and recognizing that not all of their children will live to adulthood. HIV/AIDS is prevalent in Zambia and contributes to its low life expectancy.
Zambian emigration is low compared to many other African countries and is comprised predominantly of the well-educated. The small amount of brain drain, however, has a major impact in Zambia because of its limited human capital and lack of educational infrastructure for developing skilled professionals in key fields. For example, Zambia has few schools for training doctors, nurses, and other health care workers. Its spending on education is low compared to other Sub-Saharan countries.
Age structure:
0-14 years: 45.74%
(male 4,005,134/female 3,964,969)
[see also: Age structure - 0-14 years country ranks ]
15-24 years: 20.03%
(male 1,744,843/female 1,746,561)
[see also: Age structure - 15-24 years country ranks ]
25-54 years: 28.96%
(male 2,539,697/female 2,506,724)
[see also: Age structure - 25-54 years country ranks ]
55-64 years: 3.01%
(male 242,993/female 280,804)
[see also: Age structure - 55-64 years country ranks ]
65 years and over: 2.27%
(male 173,582/female 221,316)
(2020 est.)
[see also: Age structure - 65 years and over country ranks ]
population pyramid:
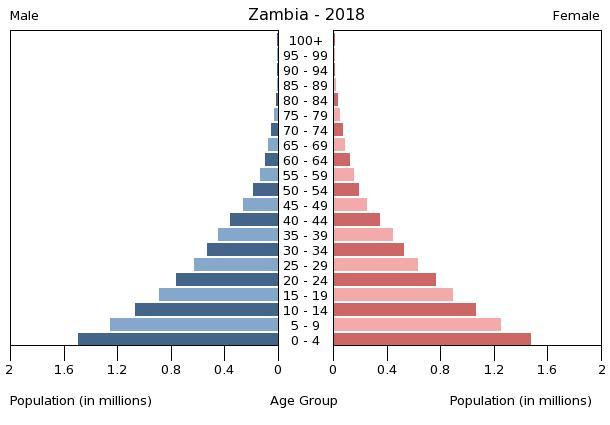
This is the population pyramid for Zambia. A population pyramid illustrates the age and sex structure of a country's population and may provide insights about political and social stability, as well as economic development. The population is distributed along the horizontal axis, with males shown on the left and females on the right. The male and female populations are broken down into 5-year age groups represented as horizontal bars along the vertical axis, with the youngest age groups at the bottom and the oldest at the top. The shape of the population pyramid gradually evolves over time based on fertility, mortality, and international migration trends.
For additional information, please see the entry for Population pyramid on the Definitions and Notes page under the References tab.
Dependency ratios:
total dependency ratio: 91.9
(2015 est.)
[see also: Dependency ratios - total dependency ratio country ranks ]
youth dependency ratio: 87.1
(2015 est.)
[see also: Dependency ratios - youth dependency ratio country ranks ]
elderly dependency ratio: 4.8
(2015 est.)
[see also: Dependency ratios - elderly dependency ratio country ranks ]
potential support ratio: 20.8
(2015 est.)
[see also: Dependency ratios - potential support ratio country ranks ]
Median age:
total: 16.9 years
[see also: Median age - total country ranks ]
male: 16.7 years
[see also: Median age - male country ranks ]
female: 17 years
(2020 est.)
[see also: Median age - female country ranks ]
country comparison to the world (CIA rank, may be based on non-current data):
221
Population growth rate:
2.89%
(2020 est.)
country comparison to the world (CIA rank, may be based on non-current data):
10
[see also: Population growth rate country ranks ]
Birth rate:
40.4 births/1,000 population
(2020 est.)
country comparison to the world (CIA rank, may be based on non-current data):
8
[see also: Birth rate country ranks ]
Death rate:
11.6 deaths/1,000 population
(2020 est.)
country comparison to the world (CIA rank, may be based on non-current data):
19
[see also: Death rate country ranks ]
Net migration rate:
0 migrant(s)/1,000 population
(2020 est.)
country comparison to the world (CIA rank, may be based on non-current data):
98
[see also: Net migration rate country ranks ]
Population distribution:
one of the highest levels of urbanization in Africa; high density in the central area, particularly around the cities of Lusaka, Ndola, Kitwe, and Mufulira
Urbanization:
urban population: 44.1% of total population
(2019)
[see also: Urbanization - urban population country ranks ]
rate of urbanization: 4.23% annual rate of change
(2015-20 est.)
[see also: Urbanization - rate of urbanization country ranks ]
Major urban areas - population:
2.647 million LUSAKA (capital)
(2019)
Sex ratio:
at birth: 1.03 male(s)/female
(2020 est.)
[see also: Sex ratio - at birth country ranks ]
0-14 years: 1.01 male(s)/female
(2020 est.)
[see also: Sex ratio - 0-14 years country ranks ]
15-24 years: 1 male(s)/female
(2020 est.)
[see also: Sex ratio - 15-24 years country ranks ]
25-54 years: 1.01 male(s)/female
(2020 est.)
[see also: Sex ratio - 25-54 years country ranks ]
55-64 years: 0.87 male(s)/female
(2020 est.)
[see also: Sex ratio - 55-64 years country ranks ]
65 years and over: 0.78 male(s)/female
(2020 est.)
[see also: Sex ratio - 65 years and over country ranks ]
total population: 99.8 male(s)/female
(2020 est.)
[see also: Sex ratio country ranks ]
Mother's mean age at first birth:
19.2 years
(2013/14 est.)
note: median age at first birth among women 25-29
[see also: Mother's mean age at first birth country ranks ]
Maternal mortality rate:
213 deaths/100,000 live births
(2017 est.)
country comparison to the world (CIA rank, may be based on non-current data):
46
[see also: Maternal mortality rate country ranks ]
Infant mortality rate:
total: 56 deaths/1,000 live births
[see also: Infant mortality rate - total country ranks ]
male: 61.1 deaths/1,000 live births
[see also: Infant mortality rate - male country ranks ]
female: 50.7 deaths/1,000 live births
(2020 est.)
[see also: Infant mortality rate - female country ranks ]
country comparison to the world (CIA rank, may be based on non-current data):
16
Life expectancy at birth:
total population: 53.6 years
[see also: Life expectancy at birth - total population country ranks ]
male: 51.9 years
[see also: Life expectancy at birth - male country ranks ]
female: 55.3 years
(2020 est.)
[see also: Life expectancy at birth - female country ranks ]
country comparison to the world (CIA rank, may be based on non-current data):
226
[See also: Healthy Life Expectancy ]
[See also: Health Performance ]
Total fertility rate:
5.49 children born/woman
(2020 est.)
country comparison to the world (CIA rank, may be based on non-current data):
10
[see also: Total fertility rate country ranks ]
Contraceptive prevalence rate:
49%
(2013/14)
[see also: Contraceptive prevalence rate country ranks ]
Drinking water source:
improved:
urban: 85.6% of population
[see also: Drinking water source - improved - urban country ranks ]
rural: 51.3% of population
[see also: Drinking water source - improved - rural country ranks ]
total: 65.4% of population
unimproved:
urban: 14.4% of population
rural: 48.7% of population
total: 34.6% of population
(2015 est.)
Current Health Expenditure:
4.5%
(2016)
[see also: Current Health Expenditure country ranks ]
Physicians density:
0.09 physicians/1,000 population
(2016)
[see also: Physicians density country ranks ]
Hospital bed density:
2 beds/1,000 population
(2010)
[see also: Hospital bed density country ranks ]
Sanitation facility access:
improved:
urban: 55.6% of population
(2015 est.)
[see also: Sanitation facility access - improved - urban country ranks ]
rural: 35.7% of population
(2015 est.)
[see also: Sanitation facility access - improved - rural country ranks ]
total: 43.9% of population
(2015 est.)
unimproved:
urban: 44.4% of population
(2015 est.)
rural: 64.3% of population
(2015 est.)
total: 56.1% of population
(2015 est.)
HIV/AIDS - adult prevalence rate:
11.3%
(2018 est.)
country comparison to the world (CIA rank, may be based on non-current data):
8
[see also: HIV/AIDS - adult prevalence rate country ranks ]
HIV/AIDS - people living with HIV/AIDS:
1.2 million
(2018 est.)
country comparison to the world (CIA rank, may be based on non-current data):
9
[see also: HIV/AIDS - people living with HIV/AIDS country ranks ]
HIV/AIDS - deaths:
17,000
(2018 est.)
country comparison to the world (CIA rank, may be based on non-current data):
12
[see also: HIV/AIDS - deaths country ranks ]
Major infectious diseases:
degree of risk:
very high
(2016)
food or waterborne diseases:
bacterial and protozoal diarrhea, hepatitis A, and typhoid fever
(2016)
vectorborne diseases:
malaria and dengue fever
(2016)
water contact diseases:
schistosomiasis
(2016)
animal contact diseases:
rabies
(2016)
Obesity - adult prevalence rate:
8.1%
(2016)
country comparison to the world (CIA rank, may be based on non-current data):
155
[see also: Obesity - adult prevalence rate country ranks ]
Children under the age of 5 years underweight:
14.9%
(2013)
country comparison to the world (CIA rank, may be based on non-current data):
44
[see also: Children under the age of 5 years underweight country ranks ]
Education expenditures:
NA
[see also: Education expenditures country ranks ]
Literacy:
definition:
age 15 and over can read and write English
total population: 63.4%
[see also: Literacy - total population country ranks ]
male: 70.9%
[see also: Literacy - male country ranks ]
female: 56%
(2015)
[see also: Literacy - female country ranks ]
Unemployment, youth ages 15-24
total: 24%
[see also: Unemployment, youth ages 15-24 - total country ranks ]
male: 23.6%
[see also: Unemployment, youth ages 15-24 - male country ranks ]
female: 24.4%
(2017 est.)
[see also: Unemployment, youth ages 15-24 - female country ranks ]
country comparison to the world (CIA rank, may be based on non-current data):
55
NOTE: 1) The information regarding Zambia on this page is re-published from the 2020 World Fact Book of the United States Central Intelligence Agency and other sources. No claims are made regarding the accuracy of Zambia People 2020 information contained here. All suggestions for corrections of any errors about Zambia People 2020 should be addressed to the CIA or the source cited on each page.
2) The rank that you see is the CIA reported rank, which may have the following issues:
a) They assign increasing rank number, alphabetically for countries with the same value of the ranked item, whereas we assign them the same rank.
b) The CIA sometimes assigns counterintuitive ranks. For example, it assigns unemployment rates in increasing order, whereas we rank them in decreasing order.
- Main Index
- 2020 Index
- Country Ranks
- Definitions
- Zambia Index 2020
- Zambia Main Index
- Introduction
- History
- Geography
- Maps
- People
- Religion
- Government
- Gov. Leaders
- Flags
- Economy
- Energy
- Communications
- Transportation
- Airport Codes
- Military
- Transnational Issues
- Photos
- Advertise Here
- Feedback

This page was last modified 27-Jan-20