


Population:
14,546,314
(July 2020 est.)
note: estimates for this country explicitly take into account the effects of excess mortality due to AIDS; this can result in lower life expectancy, higher infant mortality, higher death rates, lower population growth rates, and changes in the distribution of population by age and sex than would otherwise be expected
country comparison to the world (CIA rank, may be based on non-current data):
73
[see also: Population country ranks ]
Nationality:
noun:
Zimbabwean(s)
adjective:
Zimbabwean
Ethnic groups:
African 99.4% (predominantly Shona; Ndebele is the second largest ethnic group), other 0.4%, unspecified 0.2%
(2012 est.)
Languages:
Shona (official; most widely spoken), Ndebele (official, second most widely spoken), English (official; traditionally used for official business), 13 minority languages (official; includes Chewa, Chibarwe, Kalanga, Koisan, Nambya, Ndau, Shangani, sign language, Sotho, Tonga, Tswana, Venda, and Xhosa)
Religions:
Protestant 74.8% (includes Apostolic 37.5%, Pentecostal 21.8%, other 15.5%), Roman Catholic 7.3%, other Christian 5.3%, traditional 1.5%, Muslim 0.5%, other 0.1%, none 10.5%
(2015 est.)
Demographic profile:
Zimbabwe’s progress in reproductive, maternal, and child health has stagnated in recent years. According to a 2010 Demographic and Health Survey, contraceptive use, the number of births attended by skilled practitioners, and child mortality have either stalled or somewhat deteriorated since the mid-2000s. Zimbabwe’s total fertility rate has remained fairly stable at about 4 children per woman for the last two decades, although an uptick in the urban birth rate in recent years has caused a slight rise in the country’s overall fertility rate. Zimbabwe’s HIV prevalence rate dropped from approximately 29% to 15% since 1997 but remains among the world’s highest and continues to suppress the country’s life expectancy rate. The proliferation of HIV/AIDS information and prevention programs and personal experience with those suffering or dying from the disease have helped to change sexual behavior and reduce the epidemic.
Historically, the vast majority of Zimbabwe’s migration has been internal – a rural-urban flow. In terms of international migration, over the last 40 years Zimbabwe has gradually shifted from being a destination country to one of emigration and, to a lesser degree, one of transit (for East African illegal migrants traveling to South Africa). As a British colony, Zimbabwe attracted significant numbers of permanent immigrants from the UK and other European countries, as well as temporary economic migrants from Malawi, Mozambique, and Zambia. Although Zimbabweans have migrated to South Africa since the beginning of the 20th century to work as miners, the first major exodus from the country occurred in the years before and after independence in 1980. The outward migration was politically and racially influenced; a large share of the white population of European origin chose to leave rather than live under a new black-majority government.
In the 1990s and 2000s, economic mismanagement and hyperinflation sparked a second, more diverse wave of emigration. This massive out migration – primarily to other southern African countries, the UK, and the US – has created a variety of challenges, including brain drain, illegal migration, and human smuggling and trafficking. Several factors have pushed highly skilled workers to go abroad, including unemployment, lower wages, a lack of resources, and few opportunities for career growth.
Age structure:
0-14 years: 38.32%
(male 2,759,155/female 2,814,462)
[see also: Age structure - 0-14 years country ranks ]
15-24 years: 20.16%
(male 1,436,710/female 1,495,440)
[see also: Age structure - 15-24 years country ranks ]
25-54 years: 32.94%
(male 2,456,392/female 2,334,973)
[see also: Age structure - 25-54 years country ranks ]
55-64 years: 4.07%
(male 227,506/female 363,824)
[see also: Age structure - 55-64 years country ranks ]
65 years and over: 4.52%
(male 261,456/female 396,396)
(2020 est.)
[see also: Age structure - 65 years and over country ranks ]
population pyramid:
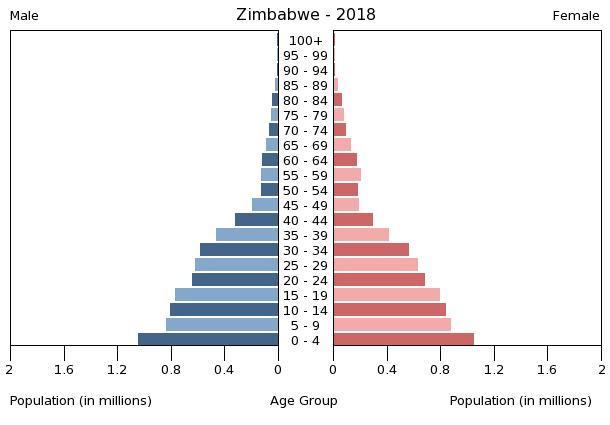
This is the population pyramid for Zimbabwe. A population pyramid illustrates the age and sex structure of a country's population and may provide insights about political and social stability, as well as economic development. The population is distributed along the horizontal axis, with males shown on the left and females on the right. The male and female populations are broken down into 5-year age groups represented as horizontal bars along the vertical axis, with the youngest age groups at the bottom and the oldest at the top. The shape of the population pyramid gradually evolves over time based on fertility, mortality, and international migration trends.
For additional information, please see the entry for Population pyramid on the Definitions and Notes page under the References tab.
Dependency ratios:
total dependency ratio: 79.5
(2015 est.)
[see also: Dependency ratios - total dependency ratio country ranks ]
youth dependency ratio: 74.4
(2015 est.)
[see also: Dependency ratios - youth dependency ratio country ranks ]
elderly dependency ratio: 5.1
(2015 est.)
[see also: Dependency ratios - elderly dependency ratio country ranks ]
potential support ratio: 19.7
(2015 est.)
[see also: Dependency ratios - potential support ratio country ranks ]
Median age:
total: 20.5 years
[see also: Median age - total country ranks ]
male: 20.3 years
[see also: Median age - male country ranks ]
female: 20.6 years
(2020 est.)
[see also: Median age - female country ranks ]
country comparison to the world (CIA rank, may be based on non-current data):
190
Population growth rate:
1.87%
(2020 est.)
country comparison to the world (CIA rank, may be based on non-current data):
53
[see also: Population growth rate country ranks ]
Birth rate:
33.6 births/1,000 population
(2020 est.)
country comparison to the world (CIA rank, may be based on non-current data):
24
[see also: Birth rate country ranks ]
Death rate:
9.3 deaths/1,000 population
(2020 est.)
country comparison to the world (CIA rank, may be based on non-current data):
53
[see also: Death rate country ranks ]
Net migration rate:
-5 migrant(s)/1,000 population
(2020 est.)
country comparison to the world (CIA rank, may be based on non-current data):
198
[see also: Net migration rate country ranks ]
Population distribution:
Aside from major urban agglomerations in Harare and Bulawayo, population distribution is fairly even, with slightly greater overall numbers in the eastern half
Urbanization:
urban population: 32.2% of total population
(2019)
[see also: Urbanization - urban population country ranks ]
rate of urbanization: 2.19% annual rate of change
(2015-20 est.)
[see also: Urbanization - rate of urbanization country ranks ]
Major urban areas - population:
1.521 million HARARE (capital)
(2019)
Sex ratio:
at birth: 1.03 male(s)/female
(2020 est.)
[see also: Sex ratio - at birth country ranks ]
0-14 years: 0.98 male(s)/female
(2020 est.)
[see also: Sex ratio - 0-14 years country ranks ]
15-24 years: 0.96 male(s)/female
(2020 est.)
[see also: Sex ratio - 15-24 years country ranks ]
25-54 years: 1.05 male(s)/female
(2020 est.)
[see also: Sex ratio - 25-54 years country ranks ]
55-64 years: 0.63 male(s)/female
(2020 est.)
[see also: Sex ratio - 55-64 years country ranks ]
65 years and over: 0.66 male(s)/female
(2020 est.)
[see also: Sex ratio - 65 years and over country ranks ]
total population: 96.4 male(s)/female
(2020 est.)
[see also: Sex ratio country ranks ]
Mother's mean age at first birth:
20 years
(2015 est.)
note: median age at first birth among women 25-29
[see also: Mother's mean age at first birth country ranks ]
Maternal mortality rate:
458 deaths/100,000 live births
(2017 est.)
country comparison to the world (CIA rank, may be based on non-current data):
24
[see also: Maternal mortality rate country ranks ]
Infant mortality rate:
total: 30.3 deaths/1,000 live births
[see also: Infant mortality rate - total country ranks ]
male: 34.2 deaths/1,000 live births
[see also: Infant mortality rate - male country ranks ]
female: 26.4 deaths/1,000 live births
(2020 est.)
[see also: Infant mortality rate - female country ranks ]
country comparison to the world (CIA rank, may be based on non-current data):
55
Life expectancy at birth:
total population: 62.3 years
[see also: Life expectancy at birth - total population country ranks ]
male: 60.2 years
[see also: Life expectancy at birth - male country ranks ]
female: 64.5 years
(2020 est.)
[see also: Life expectancy at birth - female country ranks ]
country comparison to the world (CIA rank, may be based on non-current data):
210
[See also: Healthy Life Expectancy ]
[See also: Health Performance ]
Total fertility rate:
3.93 children born/woman
(2020 est.)
country comparison to the world (CIA rank, may be based on non-current data):
31
[see also: Total fertility rate country ranks ]
Contraceptive prevalence rate:
66.8%
(2015)
[see also: Contraceptive prevalence rate country ranks ]
Drinking water source:
improved:
urban: 97% of population
[see also: Drinking water source - improved - urban country ranks ]
rural: 67.3% of population
[see also: Drinking water source - improved - rural country ranks ]
total: 76.9% of population
unimproved:
urban: 3% of population
rural: 32.7% of population
total: 23.1% of population
(2015 est.)
Current Health Expenditure:
9.4%
(2016)
[see also: Current Health Expenditure country ranks ]
Physicians density:
0.08 physicians/1,000 population
(2014)
[see also: Physicians density country ranks ]
Hospital bed density:
1.7 beds/1,000 population
(2011)
[see also: Hospital bed density country ranks ]
Sanitation facility access:
improved:
urban: 49.3% of population
(2015 est.)
[see also: Sanitation facility access - improved - urban country ranks ]
rural: 30.8% of population
(2015 est.)
[see also: Sanitation facility access - improved - rural country ranks ]
total: 36.8% of population
(2015 est.)
unimproved:
urban: 50.7% of population
(2015 est.)
rural: 69.2% of population
(2015 est.)
total: 63.2% of population
(2015 est.)
HIV/AIDS - adult prevalence rate:
12.7%
(2018 est.)
country comparison to the world (CIA rank, may be based on non-current data):
5
[see also: HIV/AIDS - adult prevalence rate country ranks ]
HIV/AIDS - people living with HIV/AIDS:
1.3 million
(2018 est.)
country comparison to the world (CIA rank, may be based on non-current data):
8
[see also: HIV/AIDS - people living with HIV/AIDS country ranks ]
HIV/AIDS - deaths:
22,000
(2018 est.)
country comparison to the world (CIA rank, may be based on non-current data):
9
[see also: HIV/AIDS - deaths country ranks ]
Major infectious diseases:
degree of risk:
high
(2016)
food or waterborne diseases:
bacterial and protozoal diarrhea, hepatitis A, and typhoid fever
(2016)
vectorborne diseases:
malaria and dengue fever
(2016)
water contact diseases:
schistosomiasis
(2016)
animal contact diseases:
rabies
(2016)
Obesity - adult prevalence rate:
15.5%
(2016)
country comparison to the world (CIA rank, may be based on non-current data):
126
[see also: Obesity - adult prevalence rate country ranks ]
Children under the age of 5 years underweight:
8.5%
(2015)
country comparison to the world (CIA rank, may be based on non-current data):
69
[see also: Children under the age of 5 years underweight country ranks ]
Education expenditures:
6.1% of GDP
(2014)
country comparison to the world (CIA rank, may be based on non-current data):
31
[see also: Education expenditures country ranks ]
Literacy:
definition:
age 15 and over can read and write English
total population: 86.5%
[see also: Literacy - total population country ranks ]
male: 88.5%
[see also: Literacy - male country ranks ]
female: 84.6%
(2015)
[see also: Literacy - female country ranks ]
School life expectancy (primary to tertiary education):
total: 10 years
[see also: School life expectancy (primary to tertiary education) - total country ranks ]
male: 10 years
[see also: School life expectancy (primary to tertiary education) - male country ranks ]
female: 10 years
[see also: School life expectancy (primary to tertiary education) - male country ranks ]
(2013)
Unemployment, youth ages 15-24
total: 16.5%
[see also: Unemployment, youth ages 15-24 - total country ranks ]
male: 11.6%
[see also: Unemployment, youth ages 15-24 - male country ranks ]
female: 21.2%
(2014 est.)
[see also: Unemployment, youth ages 15-24 - female country ranks ]
country comparison to the world (CIA rank, may be based on non-current data):
83
NOTE: 1) The information regarding Zimbabwe on this page is re-published from the 2020 World Fact Book of the United States Central Intelligence Agency and other sources. No claims are made regarding the accuracy of Zimbabwe People 2020 information contained here. All suggestions for corrections of any errors about Zimbabwe People 2020 should be addressed to the CIA or the source cited on each page.
2) The rank that you see is the CIA reported rank, which may have the following issues:
a) They assign increasing rank number, alphabetically for countries with the same value of the ranked item, whereas we assign them the same rank.
b) The CIA sometimes assigns counterintuitive ranks. For example, it assigns unemployment rates in increasing order, whereas we rank them in decreasing order.
- Main Index
- 2020 Index
- Country Ranks
- Definitions
- Zimbabwe Index 2020
- Zimbabwe Main Index
- Introduction
- History
- Geography
- Maps
- People
- Religion
- Government
- Gov. Leaders
- Flags
- Economy
- Energy
- Communications
- Transportation
- Airport Codes
- Military
- Transnational Issues
- Photos
- Advertise Here
- Feedback

This page was last modified 27-Jan-20